29
/
en
AIzaSyAYiBZKx7MnpbEhh9jyipgxe19OcubqV5w
April 1, 2024
214137
Norway
NOR
true
2
1
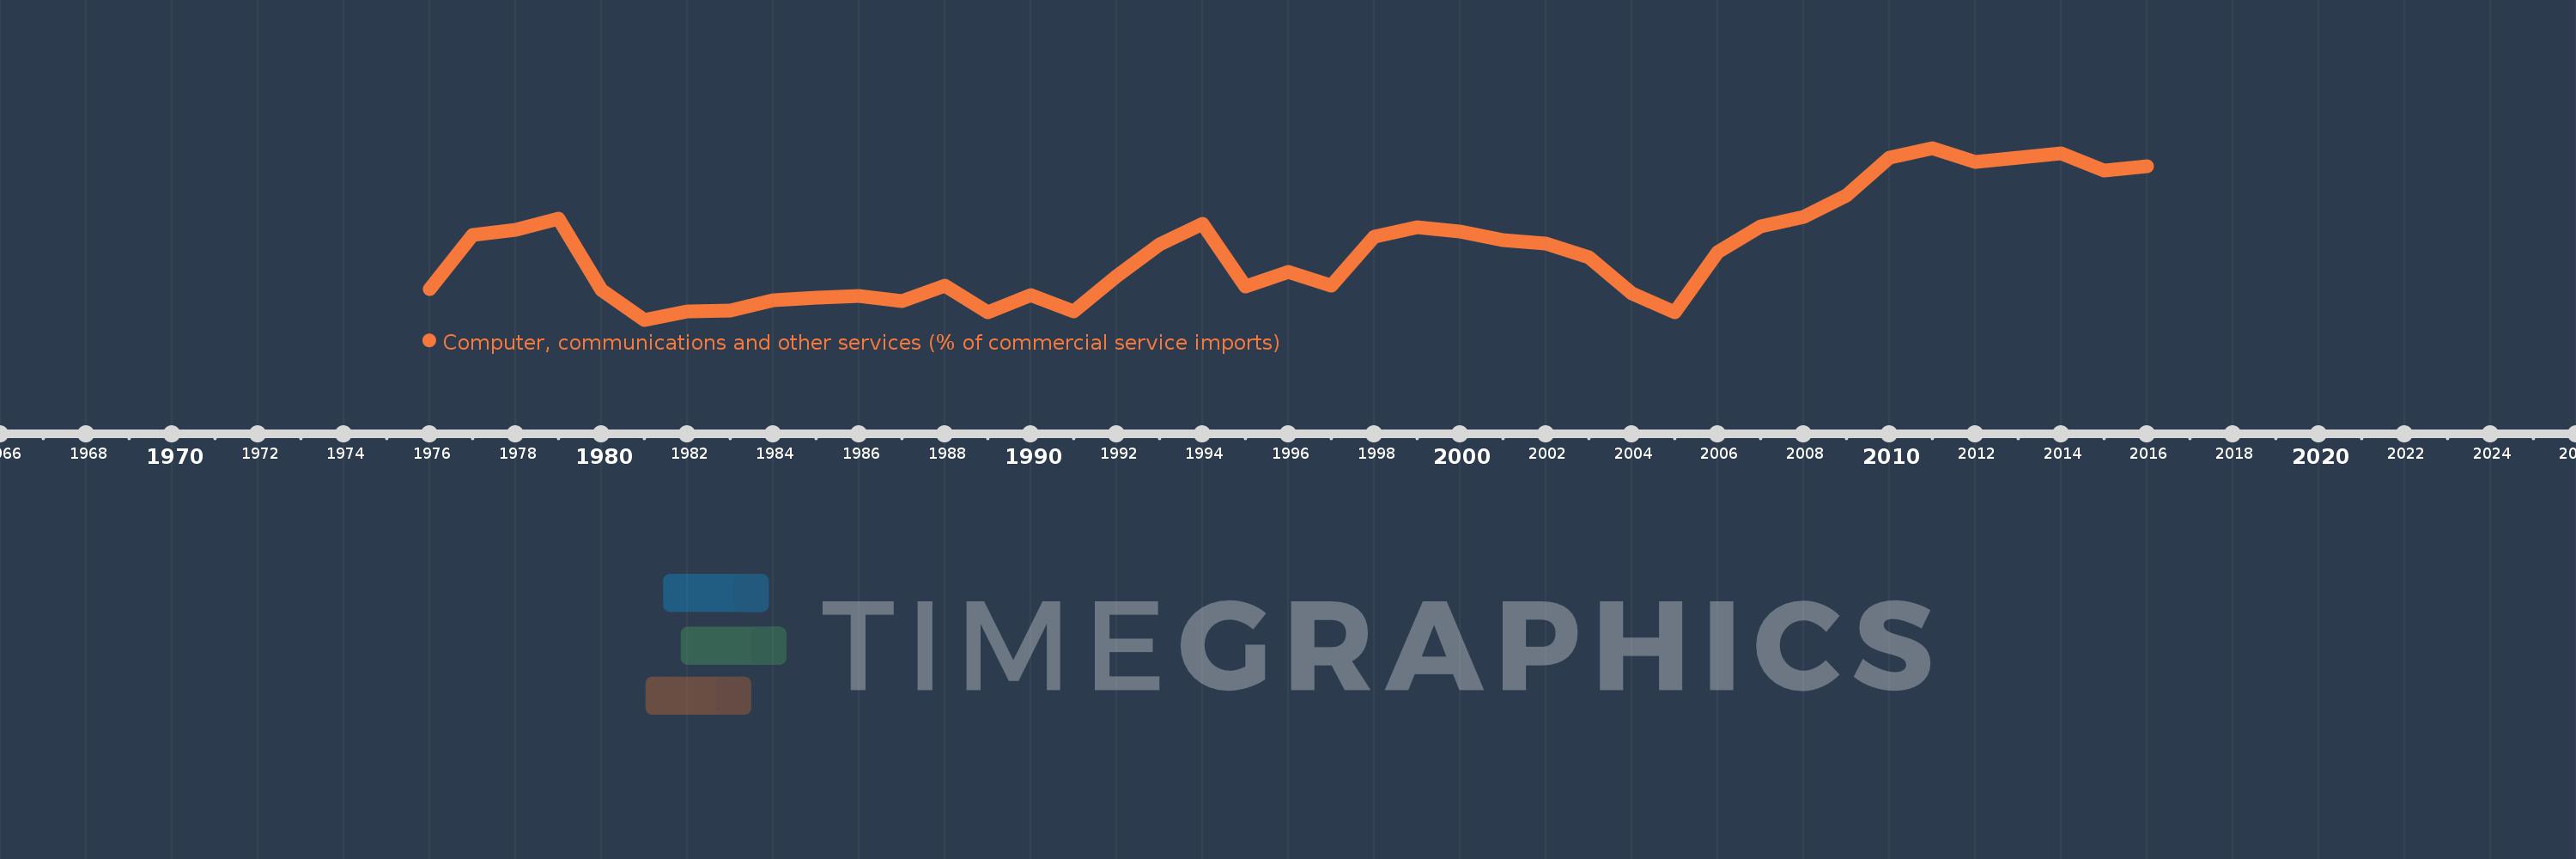
Computer, communications and other services (% of commercial service imports)
2016,2015,2014,2013,2012,2011,2010,2009,2008,2007,2006,2005,2004,2003,2002,2001,2000,1999,1998,1997,1996,1995,1994,1993,1992,1991,1990,1989,1988,1987,1986,1985,1984,1983,1982,1981,1980,1979,1978,1977,1976
This statistics in other country:
AfghanistanAlbaniaAlgeriaAngolaAntigua and BarbudaArab WorldArgentinaArmeniaArubaAustraliaAustriaAzerbaijanBahamas, TheBahrainBangladeshBarbadosBelarusBelgiumBelizeBeninBermudaBhutanBoliviaBosnia and HerzegovinaBotswanaBrazilBrunei DarussalamBulgariaBurkina FasoBurundiCabo VerdeCambodiaCameroonCanadaCaribbean small statesCentral African RepublicCentral Europe and the BalticsChadChileChinaColombiaComorosCongo, Dem. Rep.Congo, Rep.Costa RicaCote d'IvoireCroatiaCuracaoCyprusCzech RepublicDenmarkDjiboutiDominicaDominican RepublicEarly-demographic dividendEast Asia & PacificEast Asia & Pacific (excluding high income)East Asia & Pacific (IDA & IBRD countries)EcuadorEgypt, Arab Rep.El SalvadorEquatorial GuineaEritreaEstoniaEthiopiaEuro areaEurope & Central AsiaEurope & Central Asia (excluding high income)Europe & Central Asia (IDA & IBRD countries)European UnionFaroe IslandsFijiFinlandFragile and conflict affected situationsFranceFrench PolynesiaGabonGambia, TheGeorgiaGermanyGhanaGreeceGrenadaGuatemalaGuineaGuinea-BissauGuyanaHaitiHeavily indebted poor countries (HIPC)High incomeHondurasHong Kong SAR, ChinaHungaryIBRD onlyIcelandIDA & IBRD totalIDA onlyIDA totalIndiaIndonesiaIran, Islamic Rep.IraqIrelandIsraelItalyJamaicaJapanJordanKazakhstanKenyaKiribatiKorea, Rep.KosovoKuwaitKyrgyz RepublicLao PDRLate-demographic dividendLatin America & Caribbean Latin America & Caribbean (excluding high income)Latin America & the Caribbean (IDA & IBRD countries)LatviaLeast developed countries: UN classificationLebanonLesothoLiberiaLibyaLithuaniaLow & middle incomeLow incomeLower middle incomeLuxembourgMacao SAR, ChinaMacedonia, FYRMadagascarMalawiMalaysiaMaldivesMaliMaltaMarshall IslandsMauritaniaMauritiusMexicoMicronesia, Fed. Sts.Middle East & North AfricaMiddle East & North Africa (excluding high income)Middle East & North Africa (IDA & IBRD countries)Middle incomeMoldovaMongoliaMontenegroMoroccoMozambiqueMyanmarNamibiaNepalNetherlandsNew CaledoniaNew ZealandNicaraguaNigerNigeriaNorth AmericaNorwayOECD membersOmanOther small statesPacific island small statesPakistanPalauPanamaPapua New GuineaParaguayPeruPhilippinesPolandPortugalPost-demographic dividendPre-demographic dividendQatarRomaniaRussian FederationRwandaSamoaSao Tome and PrincipeSaudi ArabiaSenegalSerbiaSeychellesSierra LeoneSingaporeSint Maarten (Dutch part)Slovak RepublicSloveniaSmall statesSolomon IslandsSouth AfricaSouth AsiaSouth Asia (IDA & IBRD)South SudanSpainSri LankaSt. Kitts and NevisSt. LuciaSt. Vincent and the GrenadinesSub-Saharan Africa Sub-Saharan Africa (excluding high income)Sub-Saharan Africa (IDA & IBRD countries)SudanSurinameSwazilandSwedenSwitzerlandSyrian Arab RepublicTajikistanTanzaniaThailandTimor-LesteTogoTongaTrinidad and TobagoTunisiaTurkeyTuvaluUgandaUkraineUnited KingdomUnited StatesUpper middle incomeUruguayVanuatuVenezuela, RBWest Bank and GazaWorldYemen, Rep.ZambiaZimbabwe Timeline:
This timeline shows a graph from 1976 to 2016 of Norway. No data until 1975. Number of actual observations by date: 41.
Source name:
World Development Indicators
Source organization:
International Monetary Fund, Balance of Payments Statistics Yearbook and data files.
Categories, topics:
Private Sector, Trade
Last updated:
apr 23, 2017
Indicators value changes by year
Minimum:
22.785
jan 1, 1981
Maximum:
41.253
jan 1, 2011
At the date of observation
Value
Absolute change
Change from previous value
jan 1, 1976
26.095
+26.095
0.0%
jan 1, 1977
31.904
+5.809
22.26%
jan 1, 1978
32.499
+0.595
1.87%
jan 1, 1979
33.643
+1.144
3.52%
jan 1, 1980
26.005
-7.638
-22.7%
jan 1, 1981
22.785
-3.22
-12.38%
jan 1, 1982
23.641
+0.855
3.75%
jan 1, 1983
23.754
+0.113
0.48%
jan 1, 1984
24.842
+1.088
4.58%
jan 1, 1985
25.187
+0.345
1.39%
jan 1, 1986
25.319
+0.132
0.53%
jan 1, 1987
24.765
-0.554
-2.19%
jan 1, 1988
26.495
+1.73
6.99%
jan 1, 1989
23.593
-2.902
-10.95%
jan 1, 1990
25.393
+1.8
7.63%
jan 1, 1991
23.64
-1.753
-6.91%
jan 1, 1992
27.506
+3.866
16.35%
jan 1, 1993
30.909
+3.404
12.37%
jan 1, 1994
33.126
+2.216
7.17%
jan 1, 1995
26.319
-6.807
-20.55%
jan 1, 1996
27.95
+1.631
6.2%
jan 1, 1997
26.435
-1.515
-5.42%
jan 1, 1998
31.71
+5.275
19.95%
jan 1, 1999
32.734
+1.023
3.23%
jan 1, 2000
32.276
-0.458
-1.4%
jan 1, 2001
31.357
-0.919
-2.85%
jan 1, 2002
30.945
-0.413
-1.32%
jan 1, 2003
29.497
-1.448
-4.68%
jan 1, 2004
25.582
-3.914
-13.27%
jan 1, 2005
23.556
-2.026
-7.92%
jan 1, 2006
30.074
+6.518
27.67%
jan 1, 2007
32.788
+2.714
9.02%
jan 1, 2008
33.855
+1.067
3.26%
jan 1, 2009
36.165
+2.31
6.82%
jan 1, 2010
40.177
+4.012
11.09%
jan 1, 2011
41.253
+1.076
2.68%
jan 1, 2012
39.718
-1.535
-3.72%
jan 1, 2013
40.198
+0.48
1.21%
jan 1, 2014
40.67
+0.472
1.17%
jan 1, 2015
38.785
-1.884
-4.63%
jan 1, 2016
39.258
+0.472
1.22%
Ranking of countries by current statistics by years


Comments: