29
/
en
AIzaSyAYiBZKx7MnpbEhh9jyipgxe19OcubqV5w
April 1, 2024
269105
Turkey
TUR
true
2
1
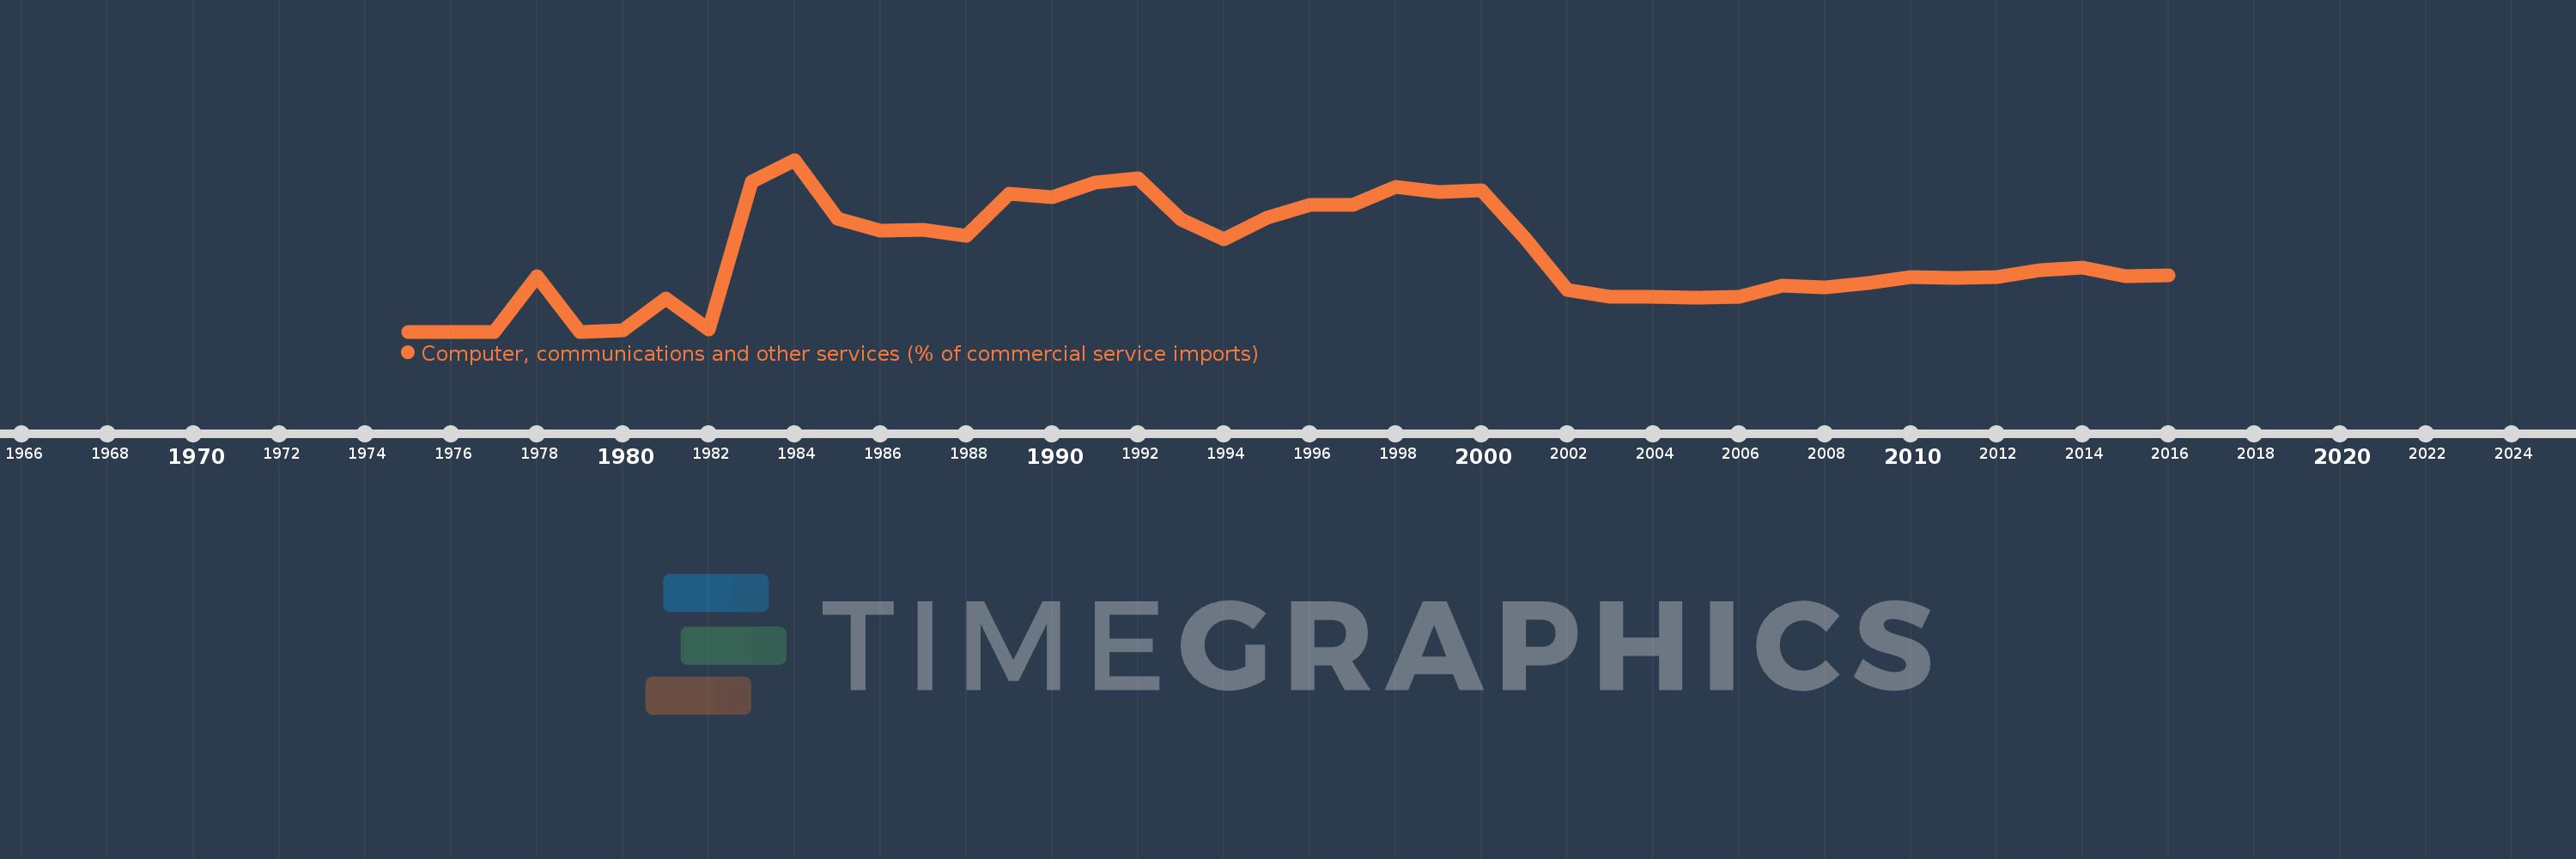
Computer, communications and other services (% of commercial service imports)
2016,2015,2014,2013,2012,2011,2010,2009,2008,2007,2006,2005,2004,2003,2002,2001,2000,1999,1998,1997,1996,1995,1994,1993,1992,1991,1990,1989,1988,1987,1986,1985,1984,1983,1982,1981,1980,1979,1978,1977,1976,1975
This statistics in other country:
AfghanistanAlbaniaAlgeriaAngolaAntigua and BarbudaArab WorldArgentinaArmeniaArubaAustraliaAustriaAzerbaijanBahamas, TheBahrainBangladeshBarbadosBelarusBelgiumBelizeBeninBermudaBhutanBoliviaBosnia and HerzegovinaBotswanaBrazilBrunei DarussalamBulgariaBurkina FasoBurundiCabo VerdeCambodiaCameroonCanadaCaribbean small statesCentral African RepublicCentral Europe and the BalticsChadChileChinaColombiaComorosCongo, Dem. Rep.Congo, Rep.Costa RicaCote d'IvoireCroatiaCuracaoCyprusCzech RepublicDenmarkDjiboutiDominicaDominican RepublicEarly-demographic dividendEast Asia & PacificEast Asia & Pacific (excluding high income)East Asia & Pacific (IDA & IBRD countries)EcuadorEgypt, Arab Rep.El SalvadorEquatorial GuineaEritreaEstoniaEthiopiaEuro areaEurope & Central AsiaEurope & Central Asia (excluding high income)Europe & Central Asia (IDA & IBRD countries)European UnionFaroe IslandsFijiFinlandFragile and conflict affected situationsFranceFrench PolynesiaGabonGambia, TheGeorgiaGermanyGhanaGreeceGrenadaGuatemalaGuineaGuinea-BissauGuyanaHaitiHeavily indebted poor countries (HIPC)High incomeHondurasHong Kong SAR, ChinaHungaryIBRD onlyIcelandIDA & IBRD totalIDA onlyIDA totalIndiaIndonesiaIran, Islamic Rep.IraqIrelandIsraelItalyJamaicaJapanJordanKazakhstanKenyaKiribatiKorea, Rep.KosovoKuwaitKyrgyz RepublicLao PDRLate-demographic dividendLatin America & Caribbean Latin America & Caribbean (excluding high income)Latin America & the Caribbean (IDA & IBRD countries)LatviaLeast developed countries: UN classificationLebanonLesothoLiberiaLibyaLithuaniaLow & middle incomeLow incomeLower middle incomeLuxembourgMacao SAR, ChinaMacedonia, FYRMadagascarMalawiMalaysiaMaldivesMaliMaltaMarshall IslandsMauritaniaMauritiusMexicoMicronesia, Fed. Sts.Middle East & North AfricaMiddle East & North Africa (excluding high income)Middle East & North Africa (IDA & IBRD countries)Middle incomeMoldovaMongoliaMontenegroMoroccoMozambiqueMyanmarNamibiaNepalNetherlandsNew CaledoniaNew ZealandNicaraguaNigerNigeriaNorth AmericaNorwayOECD membersOmanOther small statesPacific island small statesPakistanPalauPanamaPapua New GuineaParaguayPeruPhilippinesPolandPortugalPost-demographic dividendPre-demographic dividendQatarRomaniaRussian FederationRwandaSamoaSao Tome and PrincipeSaudi ArabiaSenegalSerbiaSeychellesSierra LeoneSingaporeSint Maarten (Dutch part)Slovak RepublicSloveniaSmall statesSolomon IslandsSouth AfricaSouth AsiaSouth Asia (IDA & IBRD)South SudanSpainSri LankaSt. Kitts and NevisSt. LuciaSt. Vincent and the GrenadinesSub-Saharan Africa Sub-Saharan Africa (excluding high income)Sub-Saharan Africa (IDA & IBRD countries)SudanSurinameSwazilandSwedenSwitzerlandSyrian Arab RepublicTajikistanTanzaniaThailandTimor-LesteTogoTongaTrinidad and TobagoTunisiaTurkeyTuvaluUgandaUkraineUnited KingdomUnited StatesUpper middle incomeUruguayVanuatuVenezuela, RBWest Bank and GazaWorldYemen, Rep.ZambiaZimbabwe Timeline:
This timeline shows a graph from 1975 to 2016 of Turkey. No data until 1974. Number of actual observations by date: 42.
Source name:
World Development Indicators
Source organization:
International Monetary Fund, Balance of Payments Statistics Yearbook and data files.
Categories, topics:
Private Sector, Trade
Last updated:
apr 23, 2017
Indicators value changes by year
At the date of observation
Value
Absolute change
Change from previous value
jan 1, 1978
18.138
+18.138
%
jan 1, 1979
0.0
-18.138
-100.0%
jan 1, 1980
0.341
+0.341
-2401.66 trl%
jan 1, 1981
10.944
+10.603
3.11K%
jan 1, 1982
0.775
-10.169
-92.92%
jan 1, 1983
49.368
+48.593
6.27K%
jan 1, 1984
56.57
+7.202
14.59%
jan 1, 1985
37.126
-19.445
-34.37%
jan 1, 1986
33.17
-3.956
-10.66%
jan 1, 1987
33.385
+0.215
0.65%
jan 1, 1988
31.447
-1.938
-5.81%
jan 1, 1989
45.267
+13.821
43.95%
jan 1, 1990
44.158
-1.11
-2.45%
jan 1, 1991
49.177
+5.019
11.37%
jan 1, 1992
50.358
+1.181
2.4%
jan 1, 1993
36.924
-13.434
-26.68%
jan 1, 1994
30.298
-6.626
-17.95%
jan 1, 1995
37.361
+7.063
23.31%
jan 1, 1996
41.663
+4.302
11.51%
jan 1, 1997
41.664
+0.001
0.0%
jan 1, 1998
47.681
+6.017
14.44%
jan 1, 1999
46.011
-1.67
-3.5%
jan 1, 2000
46.455
+0.444
0.96%
jan 1, 2001
30.837
-15.618
-33.62%
jan 1, 2002
13.634
-17.203
-55.79%
jan 1, 2003
11.5
-2.134
-15.65%
jan 1, 2004
11.577
+0.077
0.67%
jan 1, 2005
11.068
-0.508
-4.39%
jan 1, 2006
11.426
+0.358
3.23%
jan 1, 2007
15.049
+3.623
31.71%
jan 1, 2008
14.471
-0.578
-3.84%
jan 1, 2009
15.996
+1.524
10.53%
jan 1, 2010
17.826
+1.83
11.44%
jan 1, 2011
17.556
-0.271
-1.52%
jan 1, 2012
18.07
+0.514
2.93%
jan 1, 2013
20.183
+2.113
11.7%
jan 1, 2014
21.166
+0.983
4.87%
jan 1, 2015
18.366
-2.8
-13.23%
jan 1, 2016
18.596
+0.231
1.26%
Ranking of countries by current statistics by years


Comments: