29
/
en
AIzaSyAYiBZKx7MnpbEhh9jyipgxe19OcubqV5w
April 1, 2024
221959
Peru
PER
true
2
1
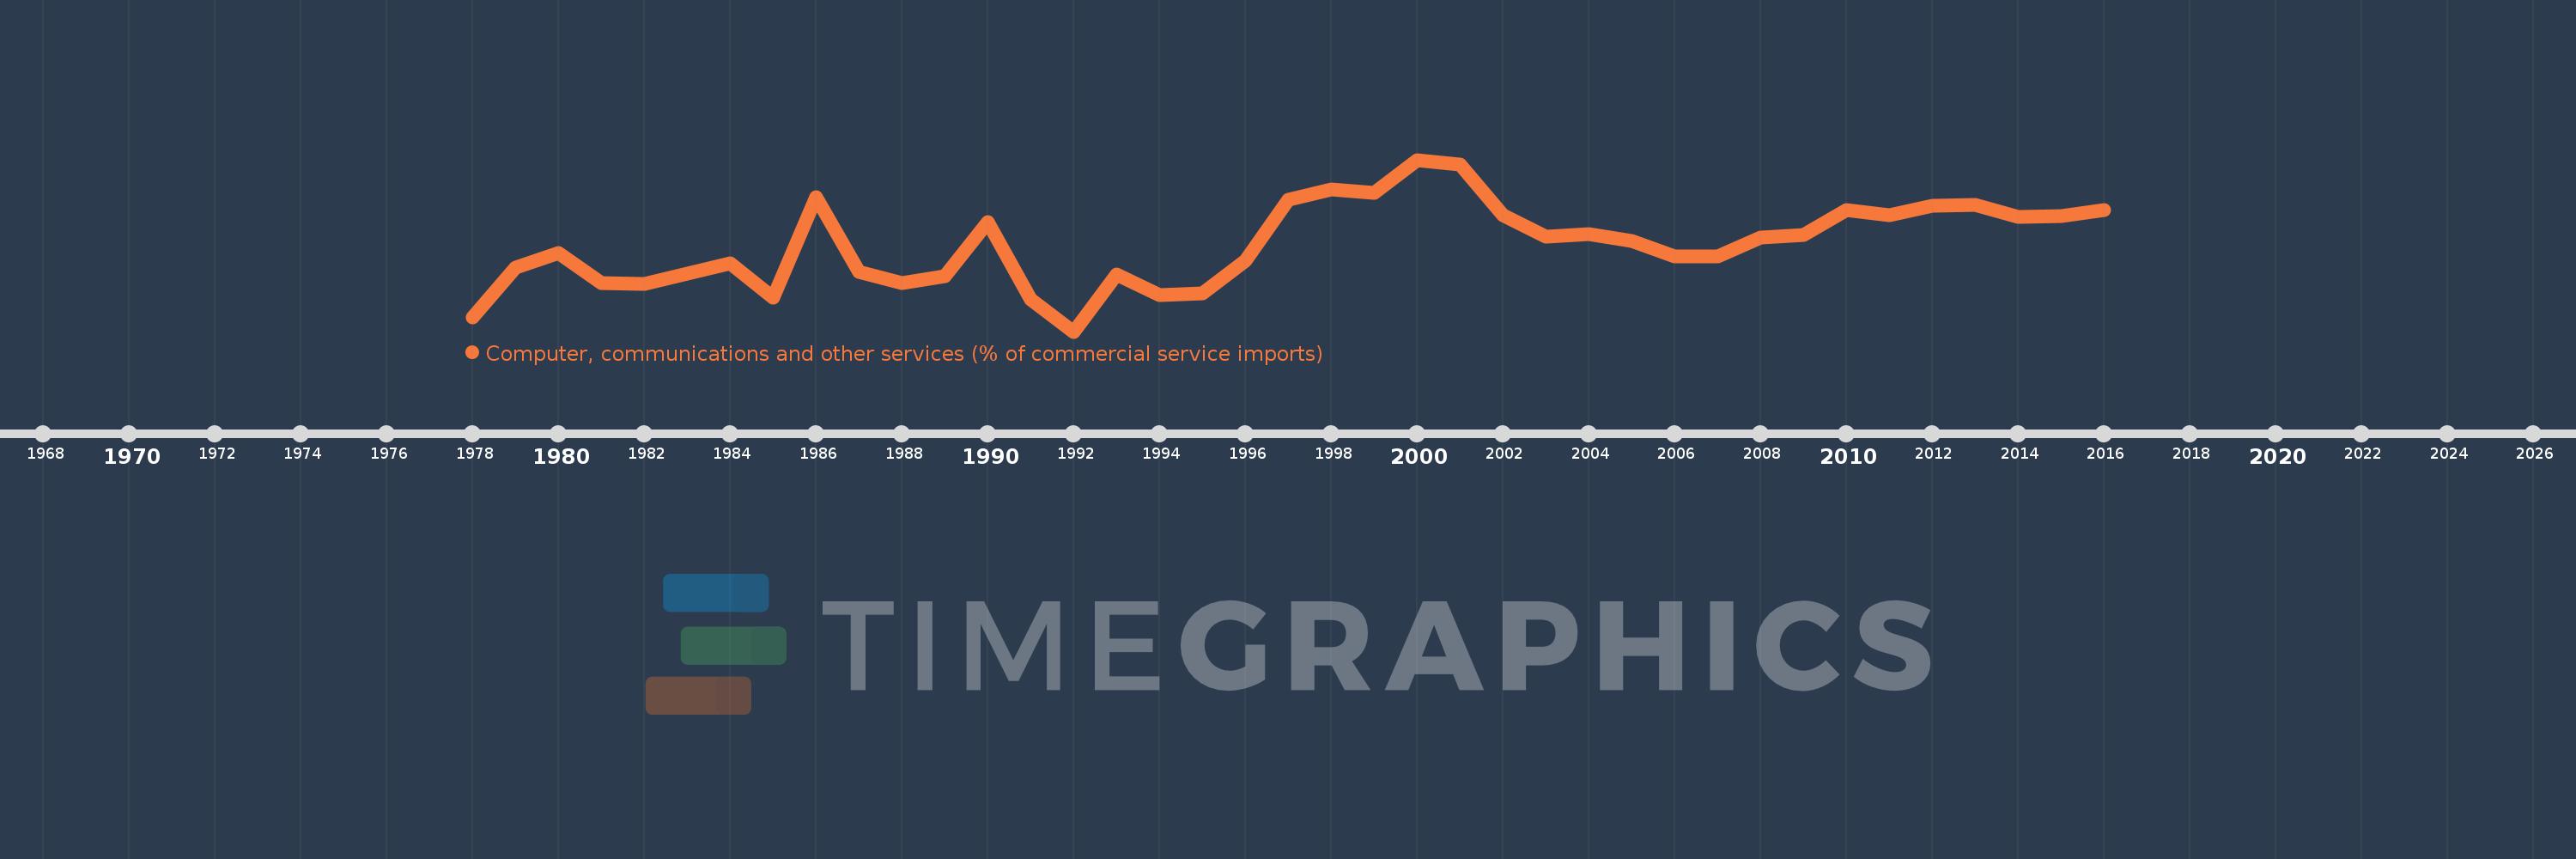
Computer, communications and other services (% of commercial service imports)
2016,2015,2014,2013,2012,2011,2010,2009,2008,2007,2006,2005,2004,2003,2002,2001,2000,1999,1998,1997,1996,1995,1994,1993,1992,1991,1990,1989,1988,1987,1986,1985,1984,1983,1982,1981,1980,1979,1978
This statistics in other country:
AfghanistanAlbaniaAlgeriaAngolaAntigua and BarbudaArab WorldArgentinaArmeniaArubaAustraliaAustriaAzerbaijanBahamas, TheBahrainBangladeshBarbadosBelarusBelgiumBelizeBeninBermudaBhutanBoliviaBosnia and HerzegovinaBotswanaBrazilBrunei DarussalamBulgariaBurkina FasoBurundiCabo VerdeCambodiaCameroonCanadaCaribbean small statesCentral African RepublicCentral Europe and the BalticsChadChileChinaColombiaComorosCongo, Dem. Rep.Congo, Rep.Costa RicaCote d'IvoireCroatiaCuracaoCyprusCzech RepublicDenmarkDjiboutiDominicaDominican RepublicEarly-demographic dividendEast Asia & PacificEast Asia & Pacific (excluding high income)East Asia & Pacific (IDA & IBRD countries)EcuadorEgypt, Arab Rep.El SalvadorEquatorial GuineaEritreaEstoniaEthiopiaEuro areaEurope & Central AsiaEurope & Central Asia (excluding high income)Europe & Central Asia (IDA & IBRD countries)European UnionFaroe IslandsFijiFinlandFragile and conflict affected situationsFranceFrench PolynesiaGabonGambia, TheGeorgiaGermanyGhanaGreeceGrenadaGuatemalaGuineaGuinea-BissauGuyanaHaitiHeavily indebted poor countries (HIPC)High incomeHondurasHong Kong SAR, ChinaHungaryIBRD onlyIcelandIDA & IBRD totalIDA onlyIDA totalIndiaIndonesiaIran, Islamic Rep.IraqIrelandIsraelItalyJamaicaJapanJordanKazakhstanKenyaKiribatiKorea, Rep.KosovoKuwaitKyrgyz RepublicLao PDRLate-demographic dividendLatin America & Caribbean Latin America & Caribbean (excluding high income)Latin America & the Caribbean (IDA & IBRD countries)LatviaLeast developed countries: UN classificationLebanonLesothoLiberiaLibyaLithuaniaLow & middle incomeLow incomeLower middle incomeLuxembourgMacao SAR, ChinaMacedonia, FYRMadagascarMalawiMalaysiaMaldivesMaliMaltaMarshall IslandsMauritaniaMauritiusMexicoMicronesia, Fed. Sts.Middle East & North AfricaMiddle East & North Africa (excluding high income)Middle East & North Africa (IDA & IBRD countries)Middle incomeMoldovaMongoliaMontenegroMoroccoMozambiqueMyanmarNamibiaNepalNetherlandsNew CaledoniaNew ZealandNicaraguaNigerNigeriaNorth AmericaNorwayOECD membersOmanOther small statesPacific island small statesPakistanPalauPanamaPapua New GuineaParaguayPeruPhilippinesPolandPortugalPost-demographic dividendPre-demographic dividendQatarRomaniaRussian FederationRwandaSamoaSao Tome and PrincipeSaudi ArabiaSenegalSerbiaSeychellesSierra LeoneSingaporeSint Maarten (Dutch part)Slovak RepublicSloveniaSmall statesSolomon IslandsSouth AfricaSouth AsiaSouth Asia (IDA & IBRD)South SudanSpainSri LankaSt. Kitts and NevisSt. LuciaSt. Vincent and the GrenadinesSub-Saharan Africa Sub-Saharan Africa (excluding high income)Sub-Saharan Africa (IDA & IBRD countries)SudanSurinameSwazilandSwedenSwitzerlandSyrian Arab RepublicTajikistanTanzaniaThailandTimor-LesteTogoTongaTrinidad and TobagoTunisiaTurkeyTuvaluUgandaUkraineUnited KingdomUnited StatesUpper middle incomeUruguayVanuatuVenezuela, RBWest Bank and GazaWorldYemen, Rep.ZambiaZimbabwe Timeline:
This timeline shows a graph from 1978 to 2016 of Peru. No data until 1977. Number of actual observations by date: 39.
Source name:
World Development Indicators
Source organization:
International Monetary Fund, Balance of Payments Statistics Yearbook and data files.
Categories, topics:
Private Sector, Trade
Last updated:
apr 23, 2017
Indicators value changes by year
Minimum:
14.914
jan 1, 1992
Maximum:
33.983
jan 1, 2000
At the date of observation
Value
Absolute change
Change from previous value
jan 1, 1978
16.476
+16.476
0.0%
jan 1, 1979
22.043
+5.567
33.79%
jan 1, 1980
23.654
+1.611
7.31%
jan 1, 1981
20.31
-3.344
-14.14%
jan 1, 1982
20.176
-0.134
-0.66%
jan 1, 1983
21.304
+1.127
5.59%
jan 1, 1984
22.534
+1.23
5.77%
jan 1, 1985
18.718
-3.815
-16.93%
jan 1, 1986
29.847
+11.129
59.45%
jan 1, 1987
21.504
-8.344
-27.95%
jan 1, 1988
20.274
-1.229
-5.72%
jan 1, 1989
21.035
+0.761
3.75%
jan 1, 1990
27.112
+6.077
28.89%
jan 1, 1991
18.494
-8.617
-31.78%
jan 1, 1992
14.914
-3.581
-19.36%
jan 1, 1993
21.285
+6.371
42.72%
jan 1, 1994
18.927
-2.357
-11.07%
jan 1, 1995
19.187
+0.259
1.37%
jan 1, 1996
22.776
+3.589
18.71%
jan 1, 1997
29.575
+6.799
29.85%
jan 1, 1998
30.735
+1.16
3.92%
jan 1, 1999
30.282
-0.453
-1.47%
jan 1, 2000
33.983
+3.701
12.22%
jan 1, 2001
33.464
-0.519
-1.53%
jan 1, 2002
27.809
-5.654
-16.9%
jan 1, 2003
25.405
-2.405
-8.65%
jan 1, 2004
25.688
+0.283
1.12%
jan 1, 2005
24.999
-0.689
-2.68%
jan 1, 2006
23.292
-1.707
-6.83%
jan 1, 2007
23.264
-0.028
-0.12%
jan 1, 2008
25.364
+2.101
9.03%
jan 1, 2009
25.651
+0.287
1.13%
jan 1, 2010
28.429
+2.778
10.83%
jan 1, 2011
27.879
-0.55
-1.93%
jan 1, 2012
28.906
+1.027
3.68%
jan 1, 2013
28.952
+0.045
0.16%
jan 1, 2014
27.641
-1.311
-4.53%
jan 1, 2015
27.775
+0.134
0.48%
jan 1, 2016
28.38
+0.605
2.18%
Ranking of countries by current statistics by years


Comments: