29
/
en
AIzaSyAYiBZKx7MnpbEhh9jyipgxe19OcubqV5w
April 1, 2024
184965
Madagascar
MDG
true
2
1
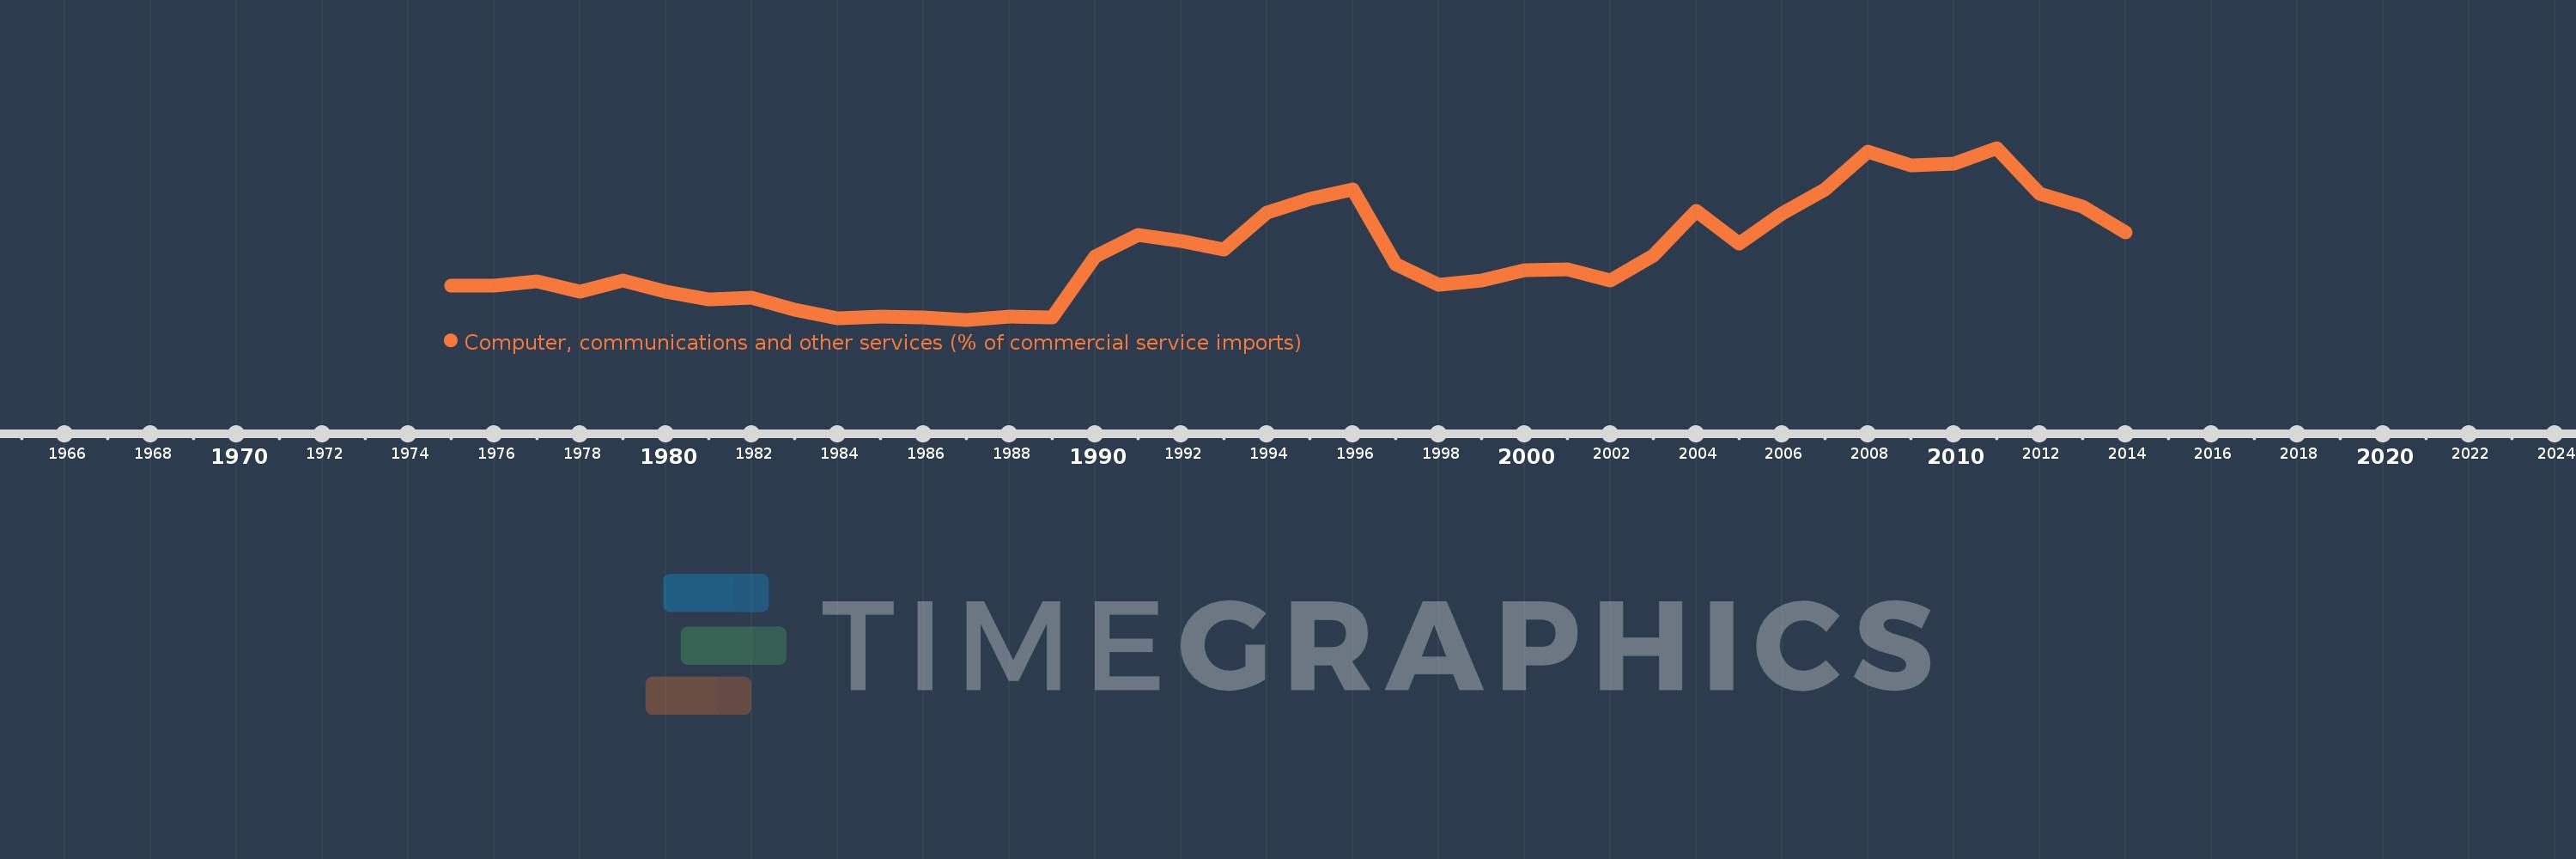
Computer, communications and other services (% of commercial service imports)
2014,2013,2012,2011,2010,2009,2008,2007,2006,2005,2004,2003,2002,2001,2000,1999,1998,1997,1996,1995,1994,1993,1992,1991,1990,1989,1988,1987,1986,1985,1984,1983,1982,1981,1980,1979,1978,1977,1976,1975
This statistics in other country:
AfghanistanAlbaniaAlgeriaAngolaAntigua and BarbudaArab WorldArgentinaArmeniaArubaAustraliaAustriaAzerbaijanBahamas, TheBahrainBangladeshBarbadosBelarusBelgiumBelizeBeninBermudaBhutanBoliviaBosnia and HerzegovinaBotswanaBrazilBrunei DarussalamBulgariaBurkina FasoBurundiCabo VerdeCambodiaCameroonCanadaCaribbean small statesCentral African RepublicCentral Europe and the BalticsChadChileChinaColombiaComorosCongo, Dem. Rep.Congo, Rep.Costa RicaCote d'IvoireCroatiaCuracaoCyprusCzech RepublicDenmarkDjiboutiDominicaDominican RepublicEarly-demographic dividendEast Asia & PacificEast Asia & Pacific (excluding high income)East Asia & Pacific (IDA & IBRD countries)EcuadorEgypt, Arab Rep.El SalvadorEquatorial GuineaEritreaEstoniaEthiopiaEuro areaEurope & Central AsiaEurope & Central Asia (excluding high income)Europe & Central Asia (IDA & IBRD countries)European UnionFaroe IslandsFijiFinlandFragile and conflict affected situationsFranceFrench PolynesiaGabonGambia, TheGeorgiaGermanyGhanaGreeceGrenadaGuatemalaGuineaGuinea-BissauGuyanaHaitiHeavily indebted poor countries (HIPC)High incomeHondurasHong Kong SAR, ChinaHungaryIBRD onlyIcelandIDA & IBRD totalIDA onlyIDA totalIndiaIndonesiaIran, Islamic Rep.IraqIrelandIsraelItalyJamaicaJapanJordanKazakhstanKenyaKiribatiKorea, Rep.KosovoKuwaitKyrgyz RepublicLao PDRLate-demographic dividendLatin America & Caribbean Latin America & Caribbean (excluding high income)Latin America & the Caribbean (IDA & IBRD countries)LatviaLeast developed countries: UN classificationLebanonLesothoLiberiaLibyaLithuaniaLow & middle incomeLow incomeLower middle incomeLuxembourgMacao SAR, ChinaMacedonia, FYRMadagascarMalawiMalaysiaMaldivesMaliMaltaMarshall IslandsMauritaniaMauritiusMexicoMicronesia, Fed. Sts.Middle East & North AfricaMiddle East & North Africa (excluding high income)Middle East & North Africa (IDA & IBRD countries)Middle incomeMoldovaMongoliaMontenegroMoroccoMozambiqueMyanmarNamibiaNepalNetherlandsNew CaledoniaNew ZealandNicaraguaNigerNigeriaNorth AmericaNorwayOECD membersOmanOther small statesPacific island small statesPakistanPalauPanamaPapua New GuineaParaguayPeruPhilippinesPolandPortugalPost-demographic dividendPre-demographic dividendQatarRomaniaRussian FederationRwandaSamoaSao Tome and PrincipeSaudi ArabiaSenegalSerbiaSeychellesSierra LeoneSingaporeSint Maarten (Dutch part)Slovak RepublicSloveniaSmall statesSolomon IslandsSouth AfricaSouth AsiaSouth Asia (IDA & IBRD)South SudanSpainSri LankaSt. Kitts and NevisSt. LuciaSt. Vincent and the GrenadinesSub-Saharan Africa Sub-Saharan Africa (excluding high income)Sub-Saharan Africa (IDA & IBRD countries)SudanSurinameSwazilandSwedenSwitzerlandSyrian Arab RepublicTajikistanTanzaniaThailandTimor-LesteTogoTongaTrinidad and TobagoTunisiaTurkeyTuvaluUgandaUkraineUnited KingdomUnited StatesUpper middle incomeUruguayVanuatuVenezuela, RBWest Bank and GazaWorldYemen, Rep.ZambiaZimbabwe Timeline:
This timeline shows a graph from 1975 to 2014 of Madagascar. No data until 1974. Number of actual observations by date: 40.
Source name:
World Development Indicators
Source organization:
International Monetary Fund, Balance of Payments Statistics Yearbook and data files.
Categories, topics:
Private Sector, Trade
Last updated:
apr 23, 2017
Indicators value changes by year
Maximum:
51.135
jan 1, 2011
At the date of observation
Value
Absolute change
Change from previous value
jan 1, 1975
17.056
+17.056
0.0%
jan 1, 1976
16.988
-0.067
-0.39%
jan 1, 1977
17.998
+1.01
5.94%
jan 1, 1978
15.439
-2.559
-14.22%
jan 1, 1979
18.27
+2.831
18.34%
jan 1, 1980
15.578
-2.693
-14.74%
jan 1, 1981
13.593
-1.985
-12.74%
jan 1, 1982
13.967
+0.374
2.75%
jan 1, 1983
11.01
-2.957
-21.17%
jan 1, 1984
8.84
-2.169
-19.7%
jan 1, 1985
9.347
+0.506
5.73%
jan 1, 1986
9.086
-0.261
-2.79%
jan 1, 1987
8.501
-0.585
-6.44%
jan 1, 1988
9.356
+0.855
10.06%
jan 1, 1989
9.122
-0.234
-2.51%
jan 1, 1990
24.241
+15.119
165.75%
jan 1, 1991
29.518
+5.277
21.77%
jan 1, 1992
28.067
-1.45
-4.91%
jan 1, 1993
25.916
-2.151
-7.66%
jan 1, 1994
35.167
+9.251
35.7%
jan 1, 1995
38.454
+3.287
9.35%
jan 1, 1996
40.852
+2.398
6.24%
jan 1, 1997
22.2
-18.652
-45.66%
jan 1, 1998
17.137
-5.063
-22.81%
jan 1, 1999
18.338
+1.201
7.01%
jan 1, 2000
20.754
+2.416
13.17%
jan 1, 2001
20.925
+0.171
0.82%
jan 1, 2002
18.276
-2.649
-12.66%
jan 1, 2003
24.465
+6.189
33.87%
jan 1, 2004
35.487
+11.022
45.05%
jan 1, 2005
27.383
-8.103
-22.84%
jan 1, 2006
34.971
+7.587
27.71%
jan 1, 2007
40.821
+5.85
16.73%
jan 1, 2008
50.119
+9.298
22.78%
jan 1, 2009
46.836
-3.283
-6.55%
jan 1, 2010
47.131
+0.296
0.63%
jan 1, 2011
51.135
+4.003
8.49%
jan 1, 2012
39.672
-11.463
-22.42%
jan 1, 2013
36.615
-3.056
-7.7%
jan 1, 2014
30.198
-6.418
-17.53%
Ranking of countries by current statistics by years


Comments: