29
/
en
AIzaSyAYiBZKx7MnpbEhh9jyipgxe19OcubqV5w
April 1, 2024
79288
Barbados
BRB
true
2
1
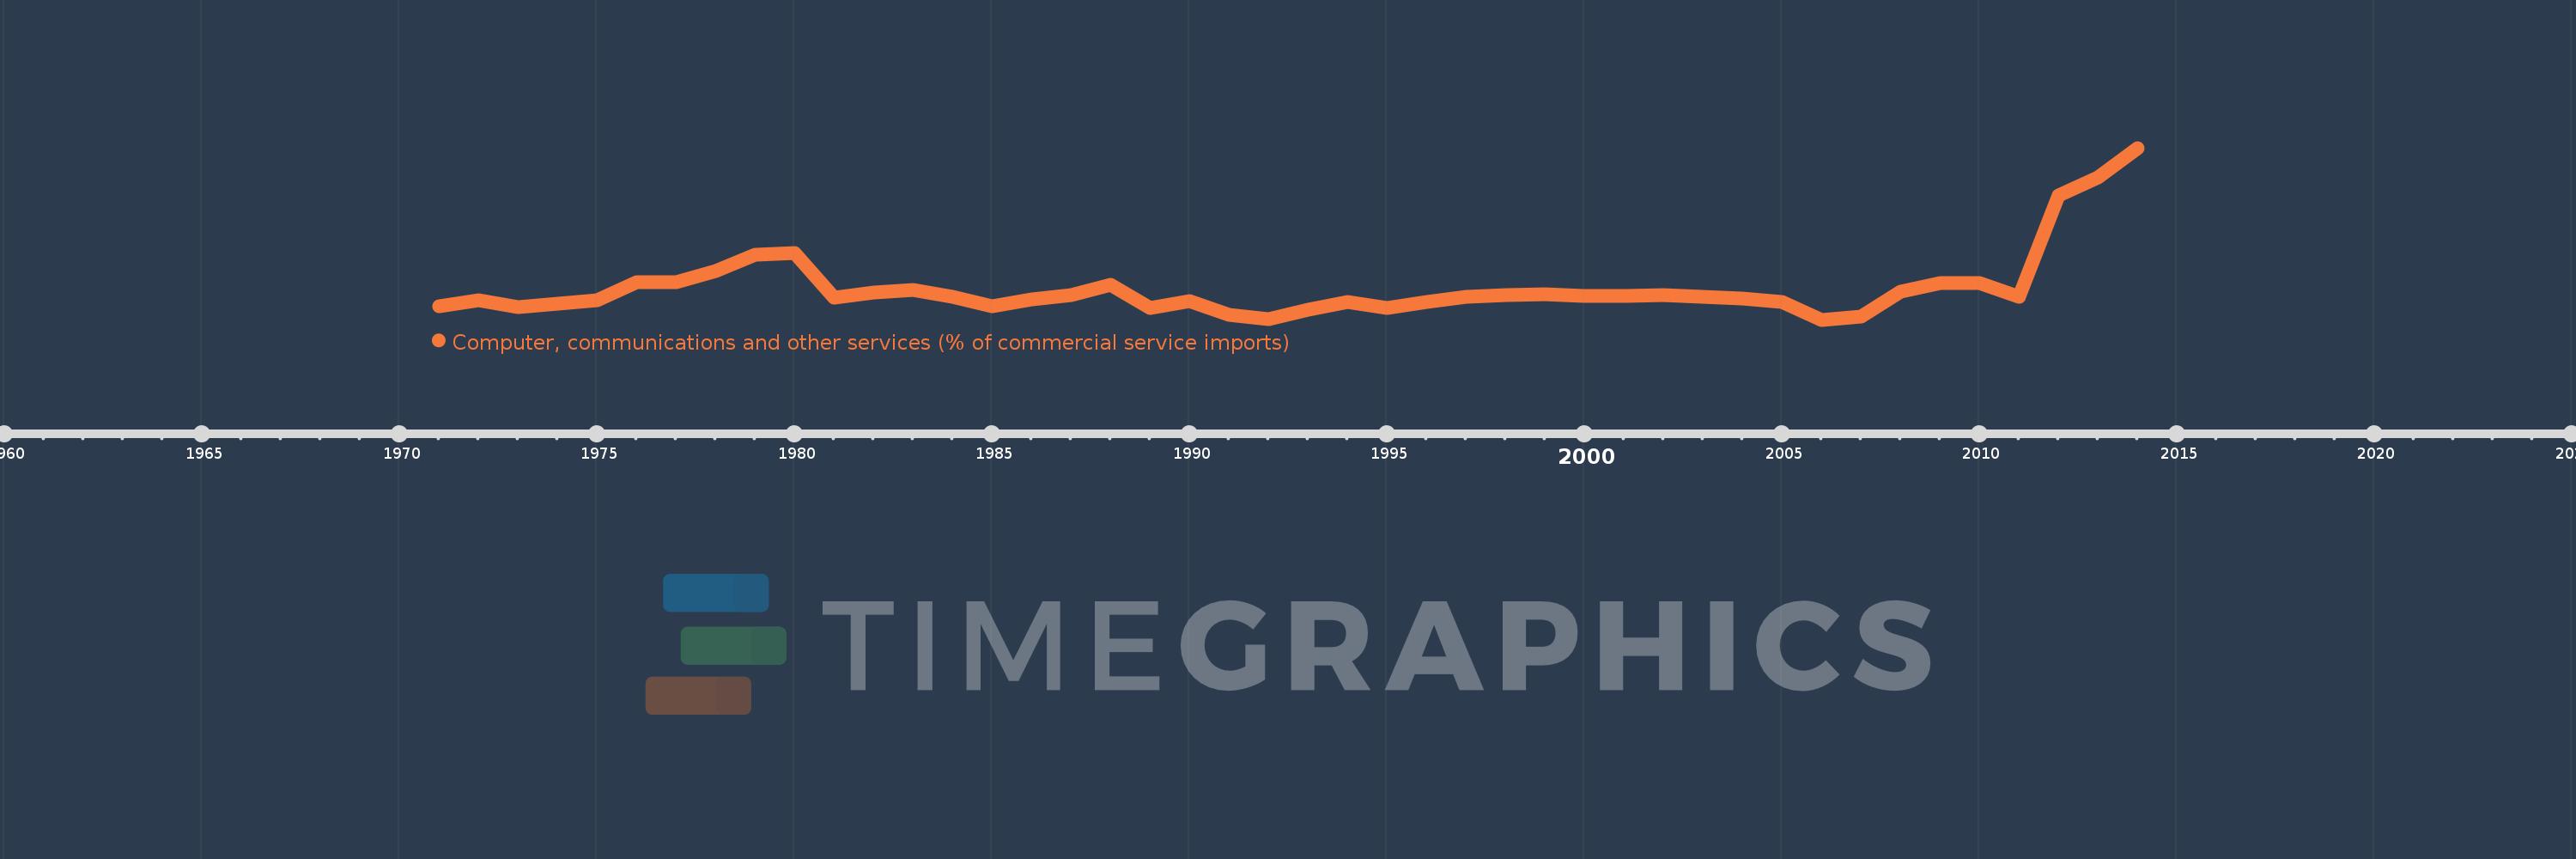
Computer, communications and other services (% of commercial service imports)
2014,2013,2012,2011,2010,2009,2008,2007,2006,2005,2004,2003,2002,2001,2000,1999,1998,1997,1996,1995,1994,1993,1992,1991,1990,1989,1988,1987,1986,1985,1984,1983,1982,1981,1980,1979,1978,1977,1976,1975,1974,1973,1972,1971
This statistics in other country:
AfghanistanAlbaniaAlgeriaAngolaAntigua and BarbudaArab WorldArgentinaArmeniaArubaAustraliaAustriaAzerbaijanBahamas, TheBahrainBangladeshBarbadosBelarusBelgiumBelizeBeninBermudaBhutanBoliviaBosnia and HerzegovinaBotswanaBrazilBrunei DarussalamBulgariaBurkina FasoBurundiCabo VerdeCambodiaCameroonCanadaCaribbean small statesCentral African RepublicCentral Europe and the BalticsChadChileChinaColombiaComorosCongo, Dem. Rep.Congo, Rep.Costa RicaCote d'IvoireCroatiaCuracaoCyprusCzech RepublicDenmarkDjiboutiDominicaDominican RepublicEarly-demographic dividendEast Asia & PacificEast Asia & Pacific (excluding high income)East Asia & Pacific (IDA & IBRD countries)EcuadorEgypt, Arab Rep.El SalvadorEquatorial GuineaEritreaEstoniaEthiopiaEuro areaEurope & Central AsiaEurope & Central Asia (excluding high income)Europe & Central Asia (IDA & IBRD countries)European UnionFaroe IslandsFijiFinlandFragile and conflict affected situationsFranceFrench PolynesiaGabonGambia, TheGeorgiaGermanyGhanaGreeceGrenadaGuatemalaGuineaGuinea-BissauGuyanaHaitiHeavily indebted poor countries (HIPC)High incomeHondurasHong Kong SAR, ChinaHungaryIBRD onlyIcelandIDA & IBRD totalIDA onlyIDA totalIndiaIndonesiaIran, Islamic Rep.IraqIrelandIsraelItalyJamaicaJapanJordanKazakhstanKenyaKiribatiKorea, Rep.KosovoKuwaitKyrgyz RepublicLao PDRLate-demographic dividendLatin America & Caribbean Latin America & Caribbean (excluding high income)Latin America & the Caribbean (IDA & IBRD countries)LatviaLeast developed countries: UN classificationLebanonLesothoLiberiaLibyaLithuaniaLow & middle incomeLow incomeLower middle incomeLuxembourgMacao SAR, ChinaMacedonia, FYRMadagascarMalawiMalaysiaMaldivesMaliMaltaMarshall IslandsMauritaniaMauritiusMexicoMicronesia, Fed. Sts.Middle East & North AfricaMiddle East & North Africa (excluding high income)Middle East & North Africa (IDA & IBRD countries)Middle incomeMoldovaMongoliaMontenegroMoroccoMozambiqueMyanmarNamibiaNepalNetherlandsNew CaledoniaNew ZealandNicaraguaNigerNigeriaNorth AmericaNorwayOECD membersOmanOther small statesPacific island small statesPakistanPalauPanamaPapua New GuineaParaguayPeruPhilippinesPolandPortugalPost-demographic dividendPre-demographic dividendQatarRomaniaRussian FederationRwandaSamoaSao Tome and PrincipeSaudi ArabiaSenegalSerbiaSeychellesSierra LeoneSingaporeSint Maarten (Dutch part)Slovak RepublicSloveniaSmall statesSolomon IslandsSouth AfricaSouth AsiaSouth Asia (IDA & IBRD)South SudanSpainSri LankaSt. Kitts and NevisSt. LuciaSt. Vincent and the GrenadinesSub-Saharan Africa Sub-Saharan Africa (excluding high income)Sub-Saharan Africa (IDA & IBRD countries)SudanSurinameSwazilandSwedenSwitzerlandSyrian Arab RepublicTajikistanTanzaniaThailandTimor-LesteTogoTongaTrinidad and TobagoTunisiaTurkeyTuvaluUgandaUkraineUnited KingdomUnited StatesUpper middle incomeUruguayVanuatuVenezuela, RBWest Bank and GazaWorldYemen, Rep.ZambiaZimbabwe Timeline:
This timeline shows a graph from 1971 to 2014 of Barbados. No data until 1970. Number of actual observations by date: 44.
Source name:
World Development Indicators
Source organization:
International Monetary Fund, Balance of Payments Statistics Yearbook and data files.
Categories, topics:
Private Sector, Trade
Last updated:
apr 23, 2017
Indicators value changes by year
Minimum:
10.367
jan 1, 2006
Maximum:
73.064
jan 1, 2014
At the date of observation
Value
Absolute change
Change from previous value
jan 1, 1971
15.326
+15.326
0.0%
jan 1, 1972
17.565
+2.239
14.61%
jan 1, 1973
15.129
-2.437
-13.87%
jan 1, 1974
16.259
+1.131
7.47%
jan 1, 1975
17.57
+1.311
8.07%
jan 1, 1976
24.062
+6.492
36.95%
jan 1, 1977
23.946
-0.116
-0.48%
jan 1, 1978
28.159
+4.213
17.59%
jan 1, 1979
34.207
+6.047
21.48%
jan 1, 1980
34.806
+0.599
1.75%
jan 1, 1981
18.448
-16.358
-47.0%
jan 1, 1982
20.351
+1.903
10.32%
jan 1, 1983
21.097
+0.746
3.66%
jan 1, 1984
18.891
-2.206
-10.46%
jan 1, 1985
15.14
-3.751
-19.86%
jan 1, 1986
17.759
+2.619
17.3%
jan 1, 1987
19.52
+1.761
9.92%
jan 1, 1988
23.153
+3.632
18.61%
jan 1, 1989
14.742
-8.41
-36.33%
jan 1, 1990
17.298
+2.556
17.34%
jan 1, 1991
12.216
-5.082
-29.38%
jan 1, 1992
10.501
-1.715
-14.04%
jan 1, 1993
13.892
+3.391
32.3%
jan 1, 1994
16.7
+2.808
20.21%
jan 1, 1995
14.754
-1.947
-11.66%
jan 1, 1996
16.739
+1.985
13.46%
jan 1, 1997
18.833
+2.094
12.51%
jan 1, 1998
19.393
+0.56
2.98%
jan 1, 1999
19.68
+0.287
1.48%
jan 1, 2000
19.182
-0.498
-2.53%
jan 1, 2001
19.109
-0.074
-0.38%
jan 1, 2002
19.424
+0.316
1.65%
jan 1, 2003
18.584
-0.84
-4.33%
jan 1, 2004
18.182
-0.401
-2.16%
jan 1, 2005
16.765
-1.418
-7.8%
jan 1, 2006
10.367
-6.398
-38.16%
jan 1, 2007
11.666
+1.299
12.53%
jan 1, 2008
20.634
+8.968
76.87%
jan 1, 2009
23.795
+3.161
15.32%
jan 1, 2010
23.89
+0.095
0.4%
jan 1, 2011
18.888
-5.002
-20.94%
jan 1, 2012
55.815
+36.927
195.51%
jan 1, 2013
62.155
+6.34
11.36%
jan 1, 2014
73.064
+10.91
17.55%
Ranking of countries by current statistics by years


Comments: