29
/
en
AIzaSyAYiBZKx7MnpbEhh9jyipgxe19OcubqV5w
April 1, 2024
223336
Philippines
PHL
true
2
1
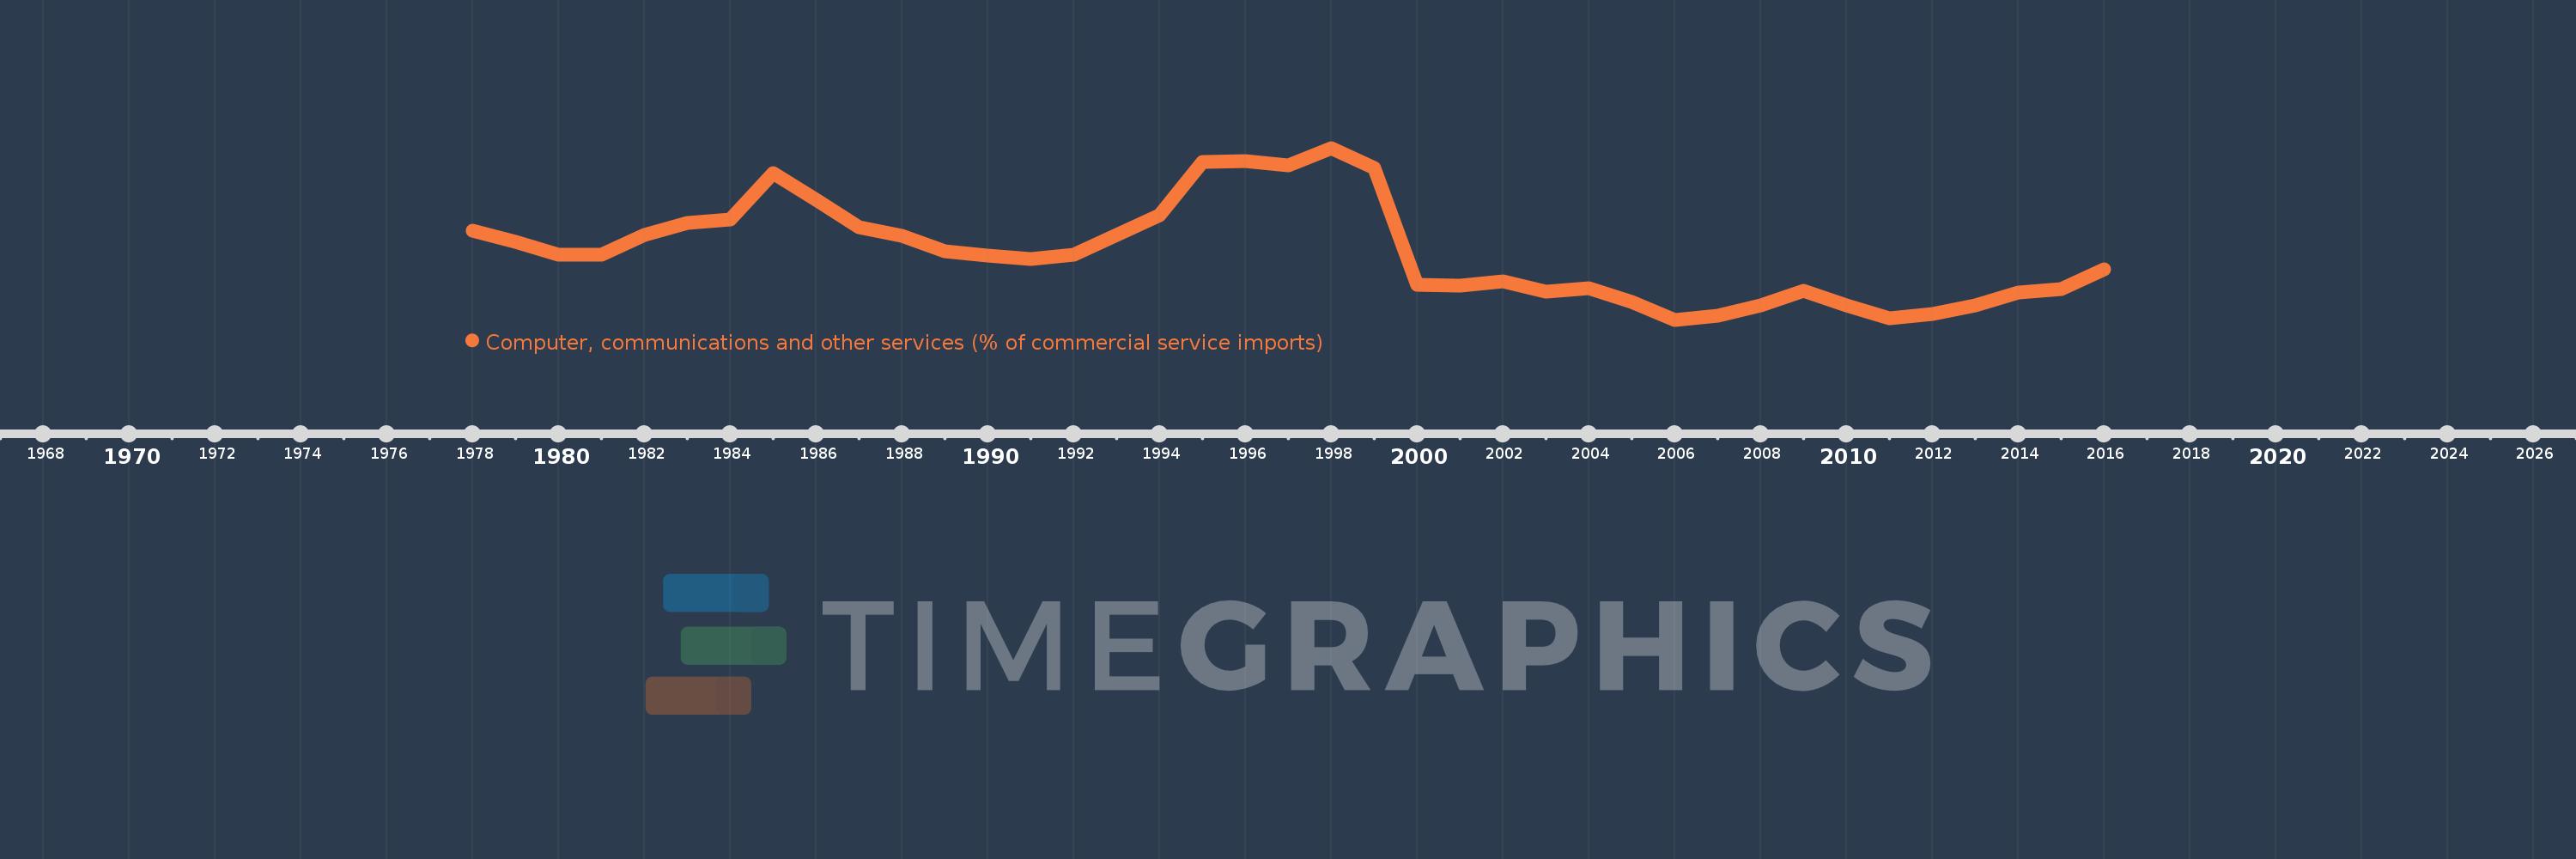
Computer, communications and other services (% of commercial service imports)
2016,2015,2014,2013,2012,2011,2010,2009,2008,2007,2006,2005,2004,2003,2002,2001,2000,1999,1998,1997,1996,1995,1994,1993,1992,1991,1990,1989,1988,1987,1986,1985,1984,1983,1982,1981,1980,1979,1978
This statistics in other country:
AfghanistanAlbaniaAlgeriaAngolaAntigua and BarbudaArab WorldArgentinaArmeniaArubaAustraliaAustriaAzerbaijanBahamas, TheBahrainBangladeshBarbadosBelarusBelgiumBelizeBeninBermudaBhutanBoliviaBosnia and HerzegovinaBotswanaBrazilBrunei DarussalamBulgariaBurkina FasoBurundiCabo VerdeCambodiaCameroonCanadaCaribbean small statesCentral African RepublicCentral Europe and the BalticsChadChileChinaColombiaComorosCongo, Dem. Rep.Congo, Rep.Costa RicaCote d'IvoireCroatiaCuracaoCyprusCzech RepublicDenmarkDjiboutiDominicaDominican RepublicEarly-demographic dividendEast Asia & PacificEast Asia & Pacific (excluding high income)East Asia & Pacific (IDA & IBRD countries)EcuadorEgypt, Arab Rep.El SalvadorEquatorial GuineaEritreaEstoniaEthiopiaEuro areaEurope & Central AsiaEurope & Central Asia (excluding high income)Europe & Central Asia (IDA & IBRD countries)European UnionFaroe IslandsFijiFinlandFragile and conflict affected situationsFranceFrench PolynesiaGabonGambia, TheGeorgiaGermanyGhanaGreeceGrenadaGuatemalaGuineaGuinea-BissauGuyanaHaitiHeavily indebted poor countries (HIPC)High incomeHondurasHong Kong SAR, ChinaHungaryIBRD onlyIcelandIDA & IBRD totalIDA onlyIDA totalIndiaIndonesiaIran, Islamic Rep.IraqIrelandIsraelItalyJamaicaJapanJordanKazakhstanKenyaKiribatiKorea, Rep.KosovoKuwaitKyrgyz RepublicLao PDRLate-demographic dividendLatin America & Caribbean Latin America & Caribbean (excluding high income)Latin America & the Caribbean (IDA & IBRD countries)LatviaLeast developed countries: UN classificationLebanonLesothoLiberiaLibyaLithuaniaLow & middle incomeLow incomeLower middle incomeLuxembourgMacao SAR, ChinaMacedonia, FYRMadagascarMalawiMalaysiaMaldivesMaliMaltaMarshall IslandsMauritaniaMauritiusMexicoMicronesia, Fed. Sts.Middle East & North AfricaMiddle East & North Africa (excluding high income)Middle East & North Africa (IDA & IBRD countries)Middle incomeMoldovaMongoliaMontenegroMoroccoMozambiqueMyanmarNamibiaNepalNetherlandsNew CaledoniaNew ZealandNicaraguaNigerNigeriaNorth AmericaNorwayOECD membersOmanOther small statesPacific island small statesPakistanPalauPanamaPapua New GuineaParaguayPeruPhilippinesPolandPortugalPost-demographic dividendPre-demographic dividendQatarRomaniaRussian FederationRwandaSamoaSao Tome and PrincipeSaudi ArabiaSenegalSerbiaSeychellesSierra LeoneSingaporeSint Maarten (Dutch part)Slovak RepublicSloveniaSmall statesSolomon IslandsSouth AfricaSouth AsiaSouth Asia (IDA & IBRD)South SudanSpainSri LankaSt. Kitts and NevisSt. LuciaSt. Vincent and the GrenadinesSub-Saharan Africa Sub-Saharan Africa (excluding high income)Sub-Saharan Africa (IDA & IBRD countries)SudanSurinameSwazilandSwedenSwitzerlandSyrian Arab RepublicTajikistanTanzaniaThailandTimor-LesteTogoTongaTrinidad and TobagoTunisiaTurkeyTuvaluUgandaUkraineUnited KingdomUnited StatesUpper middle incomeUruguayVanuatuVenezuela, RBWest Bank and GazaWorldYemen, Rep.ZambiaZimbabwe Timeline:
This timeline shows a graph from 1978 to 2016 of Philippines. No data until 1977. Number of actual observations by date: 39.
Source name:
World Development Indicators
Source organization:
International Monetary Fund, Balance of Payments Statistics Yearbook and data files.
Categories, topics:
Private Sector, Trade
Last updated:
apr 23, 2017
Indicators value changes by year
Minimum:
14.817
jan 1, 2006
Maximum:
66.475
jan 1, 1998
At the date of observation
Value
Absolute change
Change from previous value
jan 1, 1978
41.562
+41.562
0.0%
jan 1, 1979
38.281
-3.28
-7.89%
jan 1, 1980
34.283
-3.998
-10.44%
jan 1, 1981
34.294
+0.011
0.03%
jan 1, 1982
40.407
+6.113
17.82%
jan 1, 1983
43.881
+3.474
8.6%
jan 1, 1984
44.931
+1.05
2.39%
jan 1, 1985
59.008
+14.077
31.33%
jan 1, 1986
50.888
-8.12
-13.76%
jan 1, 1987
42.649
-8.239
-16.19%
jan 1, 1988
40.125
-2.524
-5.92%
jan 1, 1989
35.281
-4.844
-12.07%
jan 1, 1990
33.984
-1.296
-3.67%
jan 1, 1991
33.178
-0.806
-2.37%
jan 1, 1992
34.38
+1.202
3.62%
jan 1, 1993
40.347
+5.967
17.36%
jan 1, 1994
46.354
+6.007
14.89%
jan 1, 1995
62.19
+15.836
34.16%
jan 1, 1996
62.612
+0.422
0.68%
jan 1, 1997
61.318
-1.294
-2.07%
jan 1, 1998
66.475
+5.157
8.41%
jan 1, 1999
60.583
-5.892
-8.86%
jan 1, 2000
25.355
-35.228
-58.15%
jan 1, 2001
24.986
-0.369
-1.46%
jan 1, 2002
26.44
+1.454
5.82%
jan 1, 2003
23.258
-3.182
-12.03%
jan 1, 2004
24.344
+1.086
4.67%
jan 1, 2005
20.089
-4.255
-17.48%
jan 1, 2006
14.817
-5.272
-26.24%
jan 1, 2007
16.054
+1.236
8.34%
jan 1, 2008
19.216
+3.162
19.7%
jan 1, 2009
23.437
+4.221
21.97%
jan 1, 2010
19.062
-4.375
-18.67%
jan 1, 2011
15.354
-3.708
-19.45%
jan 1, 2012
16.46
+1.107
7.21%
jan 1, 2013
19.115
+2.654
16.13%
jan 1, 2014
23.041
+3.926
20.54%
jan 1, 2015
24.06
+1.019
4.42%
jan 1, 2016
29.881
+5.821
24.19%
Ranking of countries by current statistics by years


Comments: