29
/
en
AIzaSyAYiBZKx7MnpbEhh9jyipgxe19OcubqV5w
April 1, 2024
42198
Latin America & Caribbean (excluding high income)
LAC
false
2
1
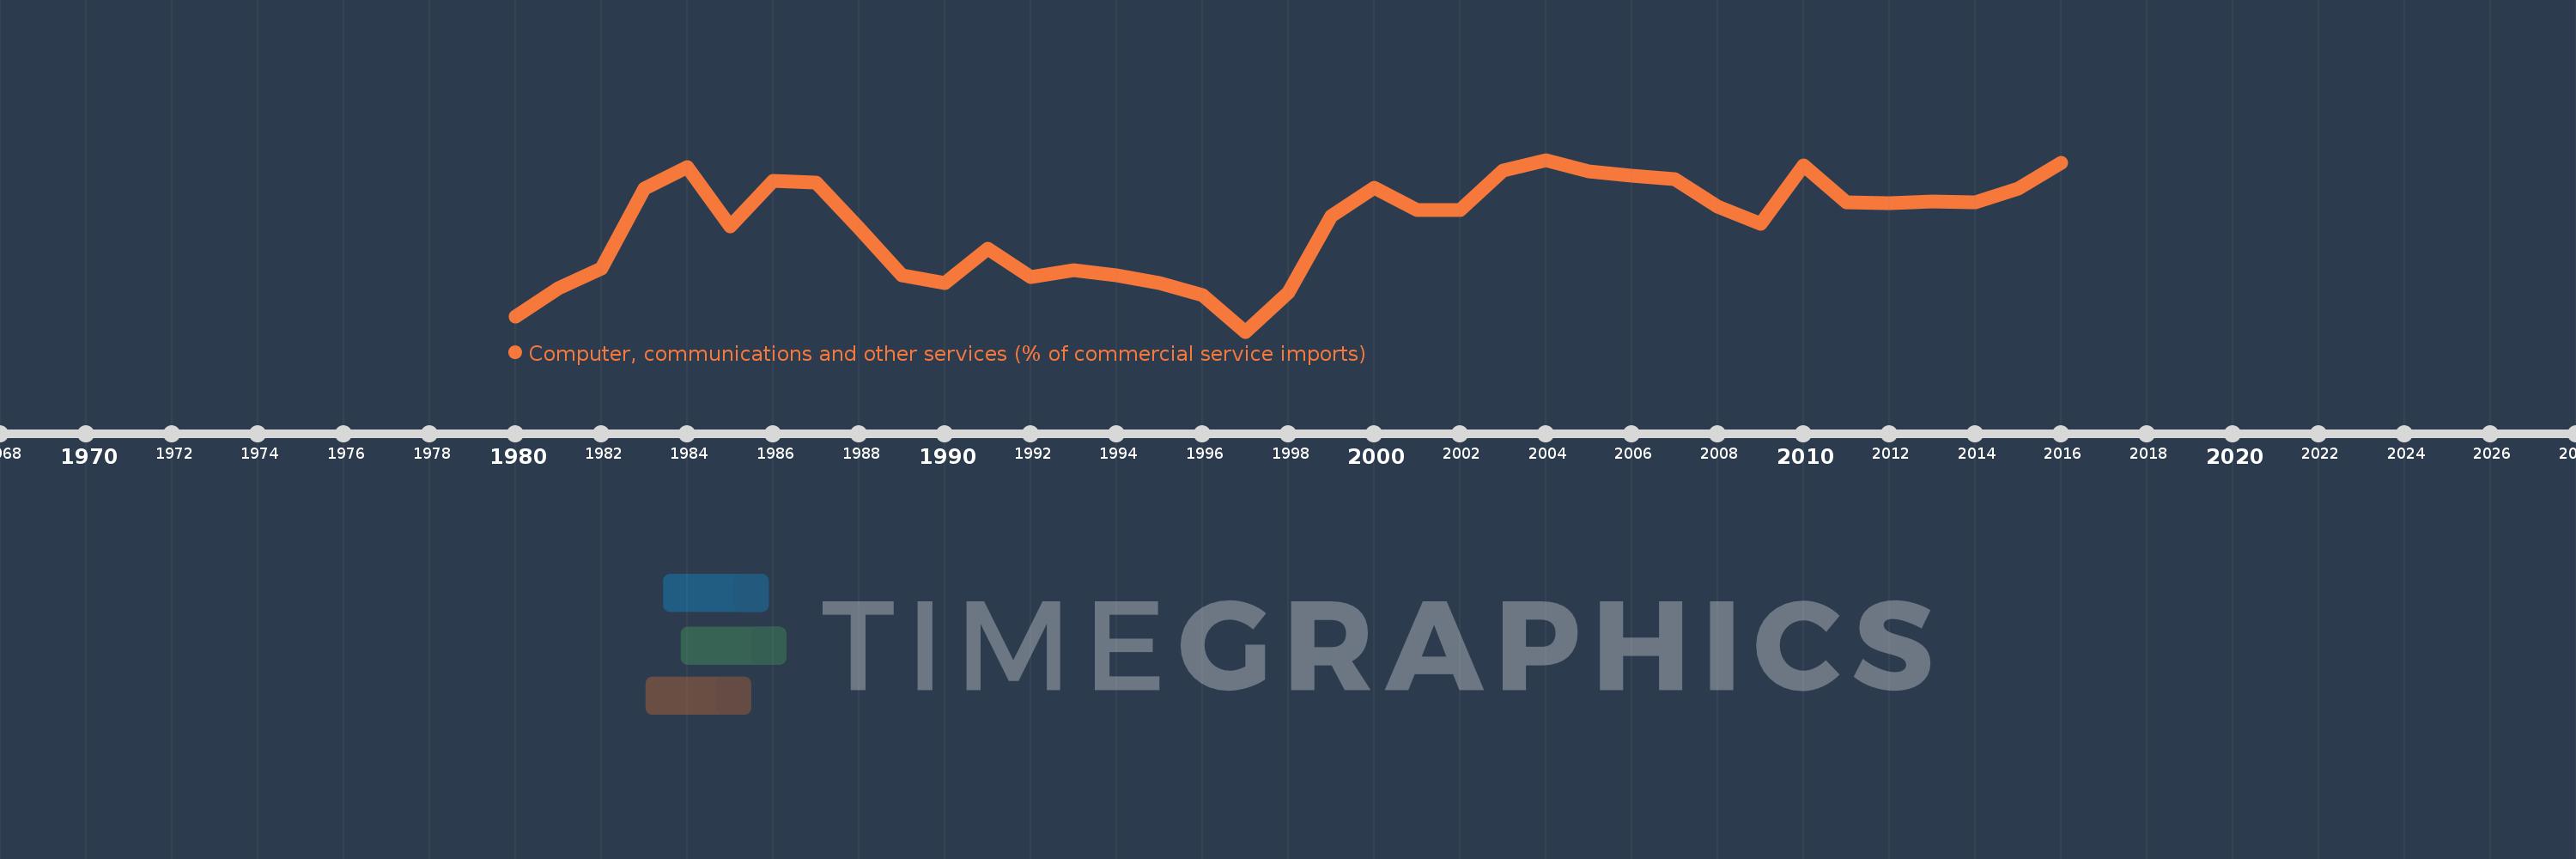
Computer, communications and other services (% of commercial service imports)
2016,2015,2014,2013,2012,2011,2010,2009,2008,2007,2006,2005,2004,2003,2002,2001,2000,1999,1998,1997,1996,1995,1994,1993,1992,1991,1990,1989,1988,1987,1986,1985,1984,1983,1982,1981,1980
This statistics in other country:
AfghanistanAlbaniaAlgeriaAngolaAntigua and BarbudaArab WorldArgentinaArmeniaArubaAustraliaAustriaAzerbaijanBahamas, TheBahrainBangladeshBarbadosBelarusBelgiumBelizeBeninBermudaBhutanBoliviaBosnia and HerzegovinaBotswanaBrazilBrunei DarussalamBulgariaBurkina FasoBurundiCabo VerdeCambodiaCameroonCanadaCaribbean small statesCentral African RepublicCentral Europe and the BalticsChadChileChinaColombiaComorosCongo, Dem. Rep.Congo, Rep.Costa RicaCote d'IvoireCroatiaCuracaoCyprusCzech RepublicDenmarkDjiboutiDominicaDominican RepublicEarly-demographic dividendEast Asia & PacificEast Asia & Pacific (excluding high income)East Asia & Pacific (IDA & IBRD countries)EcuadorEgypt, Arab Rep.El SalvadorEquatorial GuineaEritreaEstoniaEthiopiaEuro areaEurope & Central AsiaEurope & Central Asia (excluding high income)Europe & Central Asia (IDA & IBRD countries)European UnionFaroe IslandsFijiFinlandFragile and conflict affected situationsFranceFrench PolynesiaGabonGambia, TheGeorgiaGermanyGhanaGreeceGrenadaGuatemalaGuineaGuinea-BissauGuyanaHaitiHeavily indebted poor countries (HIPC)High incomeHondurasHong Kong SAR, ChinaHungaryIBRD onlyIcelandIDA & IBRD totalIDA onlyIDA totalIndiaIndonesiaIran, Islamic Rep.IraqIrelandIsraelItalyJamaicaJapanJordanKazakhstanKenyaKiribatiKorea, Rep.KosovoKuwaitKyrgyz RepublicLao PDRLate-demographic dividendLatin America & Caribbean Latin America & Caribbean (excluding high income)Latin America & the Caribbean (IDA & IBRD countries)LatviaLeast developed countries: UN classificationLebanonLesothoLiberiaLibyaLithuaniaLow & middle incomeLow incomeLower middle incomeLuxembourgMacao SAR, ChinaMacedonia, FYRMadagascarMalawiMalaysiaMaldivesMaliMaltaMarshall IslandsMauritaniaMauritiusMexicoMicronesia, Fed. Sts.Middle East & North AfricaMiddle East & North Africa (excluding high income)Middle East & North Africa (IDA & IBRD countries)Middle incomeMoldovaMongoliaMontenegroMoroccoMozambiqueMyanmarNamibiaNepalNetherlandsNew CaledoniaNew ZealandNicaraguaNigerNigeriaNorth AmericaNorwayOECD membersOmanOther small statesPacific island small statesPakistanPalauPanamaPapua New GuineaParaguayPeruPhilippinesPolandPortugalPost-demographic dividendPre-demographic dividendQatarRomaniaRussian FederationRwandaSamoaSao Tome and PrincipeSaudi ArabiaSenegalSerbiaSeychellesSierra LeoneSingaporeSint Maarten (Dutch part)Slovak RepublicSloveniaSmall statesSolomon IslandsSouth AfricaSouth AsiaSouth Asia (IDA & IBRD)South SudanSpainSri LankaSt. Kitts and NevisSt. LuciaSt. Vincent and the GrenadinesSub-Saharan Africa Sub-Saharan Africa (excluding high income)Sub-Saharan Africa (IDA & IBRD countries)SudanSurinameSwazilandSwedenSwitzerlandSyrian Arab RepublicTajikistanTanzaniaThailandTimor-LesteTogoTongaTrinidad and TobagoTunisiaTurkeyTuvaluUgandaUkraineUnited KingdomUnited StatesUpper middle incomeUruguayVanuatuVenezuela, RBWest Bank and GazaWorldYemen, Rep.ZambiaZimbabwe Timeline:
This timeline shows a graph from 1980 to 2016 of Latin America & Caribbean (excluding high income). No data until 1979. Number of actual observations by date: 37.
Source name:
World Development Indicators
Source organization:
International Monetary Fund, Balance of Payments Statistics Yearbook and data files.
Categories, topics:
Private Sector, Trade
Last updated:
apr 23, 2017
Indicators value changes by year
Minimum:
15.562
jan 1, 1997
Maximum:
26.399
jan 1, 2004
At the date of observation
Value
Absolute change
Change from previous value
jan 1, 1980
16.5
+16.5
0.0%
jan 1, 1981
18.302
+1.801
10.92%
jan 1, 1982
19.52
+1.219
6.66%
jan 1, 1983
24.606
+5.085
26.05%
jan 1, 1984
25.954
+1.348
5.48%
jan 1, 1985
22.224
-3.729
-14.37%
jan 1, 1986
25.054
+2.83
12.73%
jan 1, 1987
24.98
-0.074
-0.3%
jan 1, 1988
22.068
-2.912
-11.66%
jan 1, 1989
19.135
-2.933
-13.29%
jan 1, 1990
18.606
-0.529
-2.76%
jan 1, 1991
20.768
+2.161
11.62%
jan 1, 1992
19.029
-1.738
-8.37%
jan 1, 1993
19.454
+0.424
2.23%
jan 1, 1994
19.09
-0.363
-1.87%
jan 1, 1995
18.603
-0.488
-2.56%
jan 1, 1996
17.858
-0.745
-4.0%
jan 1, 1997
15.562
-2.296
-12.86%
jan 1, 1998
18.037
+2.475
15.9%
jan 1, 1999
22.862
+4.825
26.75%
jan 1, 2000
24.638
+1.776
7.77%
jan 1, 2001
23.225
-1.413
-5.74%
jan 1, 2002
23.244
+0.019
0.08%
jan 1, 2003
25.727
+2.483
10.68%
jan 1, 2004
26.399
+0.672
2.61%
jan 1, 2005
25.65
-0.748
-2.83%
jan 1, 2006
25.397
-0.254
-0.99%
jan 1, 2007
25.163
-0.234
-0.92%
jan 1, 2008
23.439
-1.724
-6.85%
jan 1, 2009
22.34
-1.098
-4.68%
jan 1, 2010
26.068
+3.728
16.69%
jan 1, 2011
23.715
-2.353
-9.03%
jan 1, 2012
23.663
-0.052
-0.22%
jan 1, 2013
23.777
+0.114
0.48%
jan 1, 2014
23.701
-0.076
-0.32%
jan 1, 2015
24.57
+0.869
3.67%
jan 1, 2016
26.218
+1.648
6.71%
Ranking of countries by current statistics by years


Comments: