29
/
en
AIzaSyAYiBZKx7MnpbEhh9jyipgxe19OcubqV5w
April 1, 2024
30537
Europe & Central Asia
ECS
false
2
1
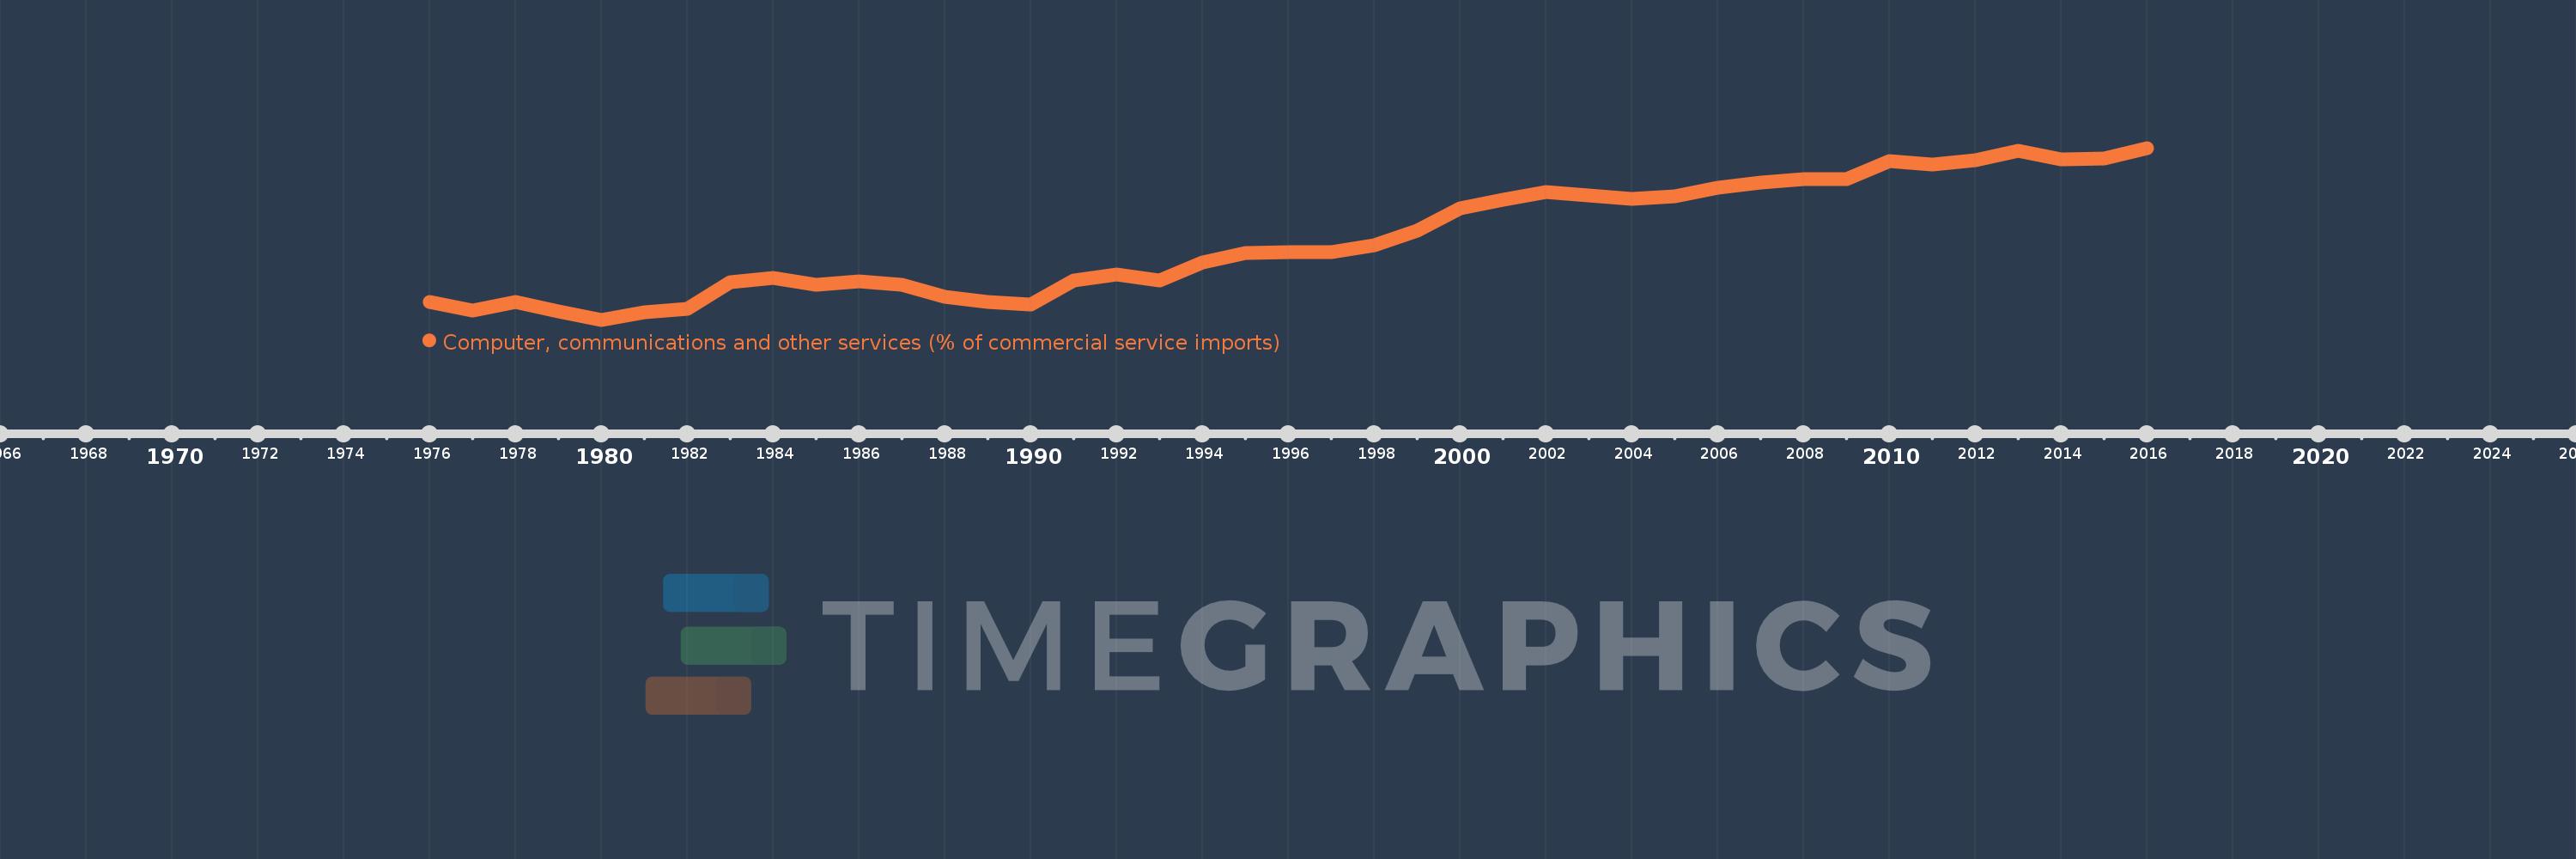
Computer, communications and other services (% of commercial service imports)
2016,2015,2014,2013,2012,2011,2010,2009,2008,2007,2006,2005,2004,2003,2002,2001,2000,1999,1998,1997,1996,1995,1994,1993,1992,1991,1990,1989,1988,1987,1986,1985,1984,1983,1982,1981,1980,1979,1978,1977,1976
This statistics in other country:
AfghanistanAlbaniaAlgeriaAngolaAntigua and BarbudaArab WorldArgentinaArmeniaArubaAustraliaAustriaAzerbaijanBahamas, TheBahrainBangladeshBarbadosBelarusBelgiumBelizeBeninBermudaBhutanBoliviaBosnia and HerzegovinaBotswanaBrazilBrunei DarussalamBulgariaBurkina FasoBurundiCabo VerdeCambodiaCameroonCanadaCaribbean small statesCentral African RepublicCentral Europe and the BalticsChadChileChinaColombiaComorosCongo, Dem. Rep.Congo, Rep.Costa RicaCote d'IvoireCroatiaCuracaoCyprusCzech RepublicDenmarkDjiboutiDominicaDominican RepublicEarly-demographic dividendEast Asia & PacificEast Asia & Pacific (excluding high income)East Asia & Pacific (IDA & IBRD countries)EcuadorEgypt, Arab Rep.El SalvadorEquatorial GuineaEritreaEstoniaEthiopiaEuro areaEurope & Central AsiaEurope & Central Asia (excluding high income)Europe & Central Asia (IDA & IBRD countries)European UnionFaroe IslandsFijiFinlandFragile and conflict affected situationsFranceFrench PolynesiaGabonGambia, TheGeorgiaGermanyGhanaGreeceGrenadaGuatemalaGuineaGuinea-BissauGuyanaHaitiHeavily indebted poor countries (HIPC)High incomeHondurasHong Kong SAR, ChinaHungaryIBRD onlyIcelandIDA & IBRD totalIDA onlyIDA totalIndiaIndonesiaIran, Islamic Rep.IraqIrelandIsraelItalyJamaicaJapanJordanKazakhstanKenyaKiribatiKorea, Rep.KosovoKuwaitKyrgyz RepublicLao PDRLate-demographic dividendLatin America & Caribbean Latin America & Caribbean (excluding high income)Latin America & the Caribbean (IDA & IBRD countries)LatviaLeast developed countries: UN classificationLebanonLesothoLiberiaLibyaLithuaniaLow & middle incomeLow incomeLower middle incomeLuxembourgMacao SAR, ChinaMacedonia, FYRMadagascarMalawiMalaysiaMaldivesMaliMaltaMarshall IslandsMauritaniaMauritiusMexicoMicronesia, Fed. Sts.Middle East & North AfricaMiddle East & North Africa (excluding high income)Middle East & North Africa (IDA & IBRD countries)Middle incomeMoldovaMongoliaMontenegroMoroccoMozambiqueMyanmarNamibiaNepalNetherlandsNew CaledoniaNew ZealandNicaraguaNigerNigeriaNorth AmericaNorwayOECD membersOmanOther small statesPacific island small statesPakistanPalauPanamaPapua New GuineaParaguayPeruPhilippinesPolandPortugalPost-demographic dividendPre-demographic dividendQatarRomaniaRussian FederationRwandaSamoaSao Tome and PrincipeSaudi ArabiaSenegalSerbiaSeychellesSierra LeoneSingaporeSint Maarten (Dutch part)Slovak RepublicSloveniaSmall statesSolomon IslandsSouth AfricaSouth AsiaSouth Asia (IDA & IBRD)South SudanSpainSri LankaSt. Kitts and NevisSt. LuciaSt. Vincent and the GrenadinesSub-Saharan Africa Sub-Saharan Africa (excluding high income)Sub-Saharan Africa (IDA & IBRD countries)SudanSurinameSwazilandSwedenSwitzerlandSyrian Arab RepublicTajikistanTanzaniaThailandTimor-LesteTogoTongaTrinidad and TobagoTunisiaTurkeyTuvaluUgandaUkraineUnited KingdomUnited StatesUpper middle incomeUruguayVanuatuVenezuela, RBWest Bank and GazaWorldYemen, Rep.ZambiaZimbabwe Timeline:
This timeline shows a graph from 1976 to 2016 of Europe & Central Asia. No data until 1975. Number of actual observations by date: 41.
Source name:
World Development Indicators
Source organization:
International Monetary Fund, Balance of Payments Statistics Yearbook and data files.
Categories, topics:
Private Sector, Trade
Last updated:
apr 23, 2017
Indicators value changes by year
Minimum:
27.133
jan 1, 1980
Maximum:
48.338
jan 1, 2016
At the date of observation
Value
Absolute change
Change from previous value
jan 1, 1976
29.309
+29.309
0.0%
jan 1, 1977
28.28
-1.029
-3.51%
jan 1, 1978
29.318
+1.038
3.67%
jan 1, 1979
28.201
-1.117
-3.81%
jan 1, 1980
27.133
-1.069
-3.79%
jan 1, 1981
28.041
+0.908
3.35%
jan 1, 1982
28.492
+0.452
1.61%
jan 1, 1983
31.797
+3.305
11.6%
jan 1, 1984
32.292
+0.495
1.56%
jan 1, 1985
31.444
-0.848
-2.63%
jan 1, 1986
31.918
+0.473
1.51%
jan 1, 1987
31.484
-0.434
-1.36%
jan 1, 1988
29.966
-1.518
-4.82%
jan 1, 1989
29.346
-0.62
-2.07%
jan 1, 1990
29.04
-0.306
-1.04%
jan 1, 1991
32.022
+2.982
10.27%
jan 1, 1992
32.721
+0.699
2.18%
jan 1, 1993
31.943
-0.778
-2.38%
jan 1, 1994
34.223
+2.28
7.14%
jan 1, 1995
35.409
+1.185
3.46%
jan 1, 1996
35.432
+0.023
0.07%
jan 1, 1997
35.529
+0.097
0.27%
jan 1, 1998
36.301
+0.772
2.17%
jan 1, 1999
38.092
+1.791
4.93%
jan 1, 2000
40.895
+2.803
7.36%
jan 1, 2001
41.929
+1.034
2.53%
jan 1, 2002
42.928
+0.999
2.38%
jan 1, 2003
42.434
-0.494
-1.15%
jan 1, 2004
42.048
-0.386
-0.91%
jan 1, 2005
42.316
+0.268
0.64%
jan 1, 2006
43.471
+1.155
2.73%
jan 1, 2007
44.108
+0.636
1.46%
jan 1, 2008
44.491
+0.384
0.87%
jan 1, 2009
44.451
-0.041
-0.09%
jan 1, 2010
46.71
+2.259
5.08%
jan 1, 2011
46.26
-0.45
-0.96%
jan 1, 2012
46.843
+0.583
1.26%
jan 1, 2013
47.965
+1.122
2.4%
jan 1, 2014
46.891
-1.074
-2.24%
jan 1, 2015
47.032
+0.141
0.3%
jan 1, 2016
48.338
+1.305
2.78%
Ranking of countries by current statistics by years


Comments: