29
/
en
AIzaSyAYiBZKx7MnpbEhh9jyipgxe19OcubqV5w
April 1, 2024
152344
Hungary
HUN
true
2
1
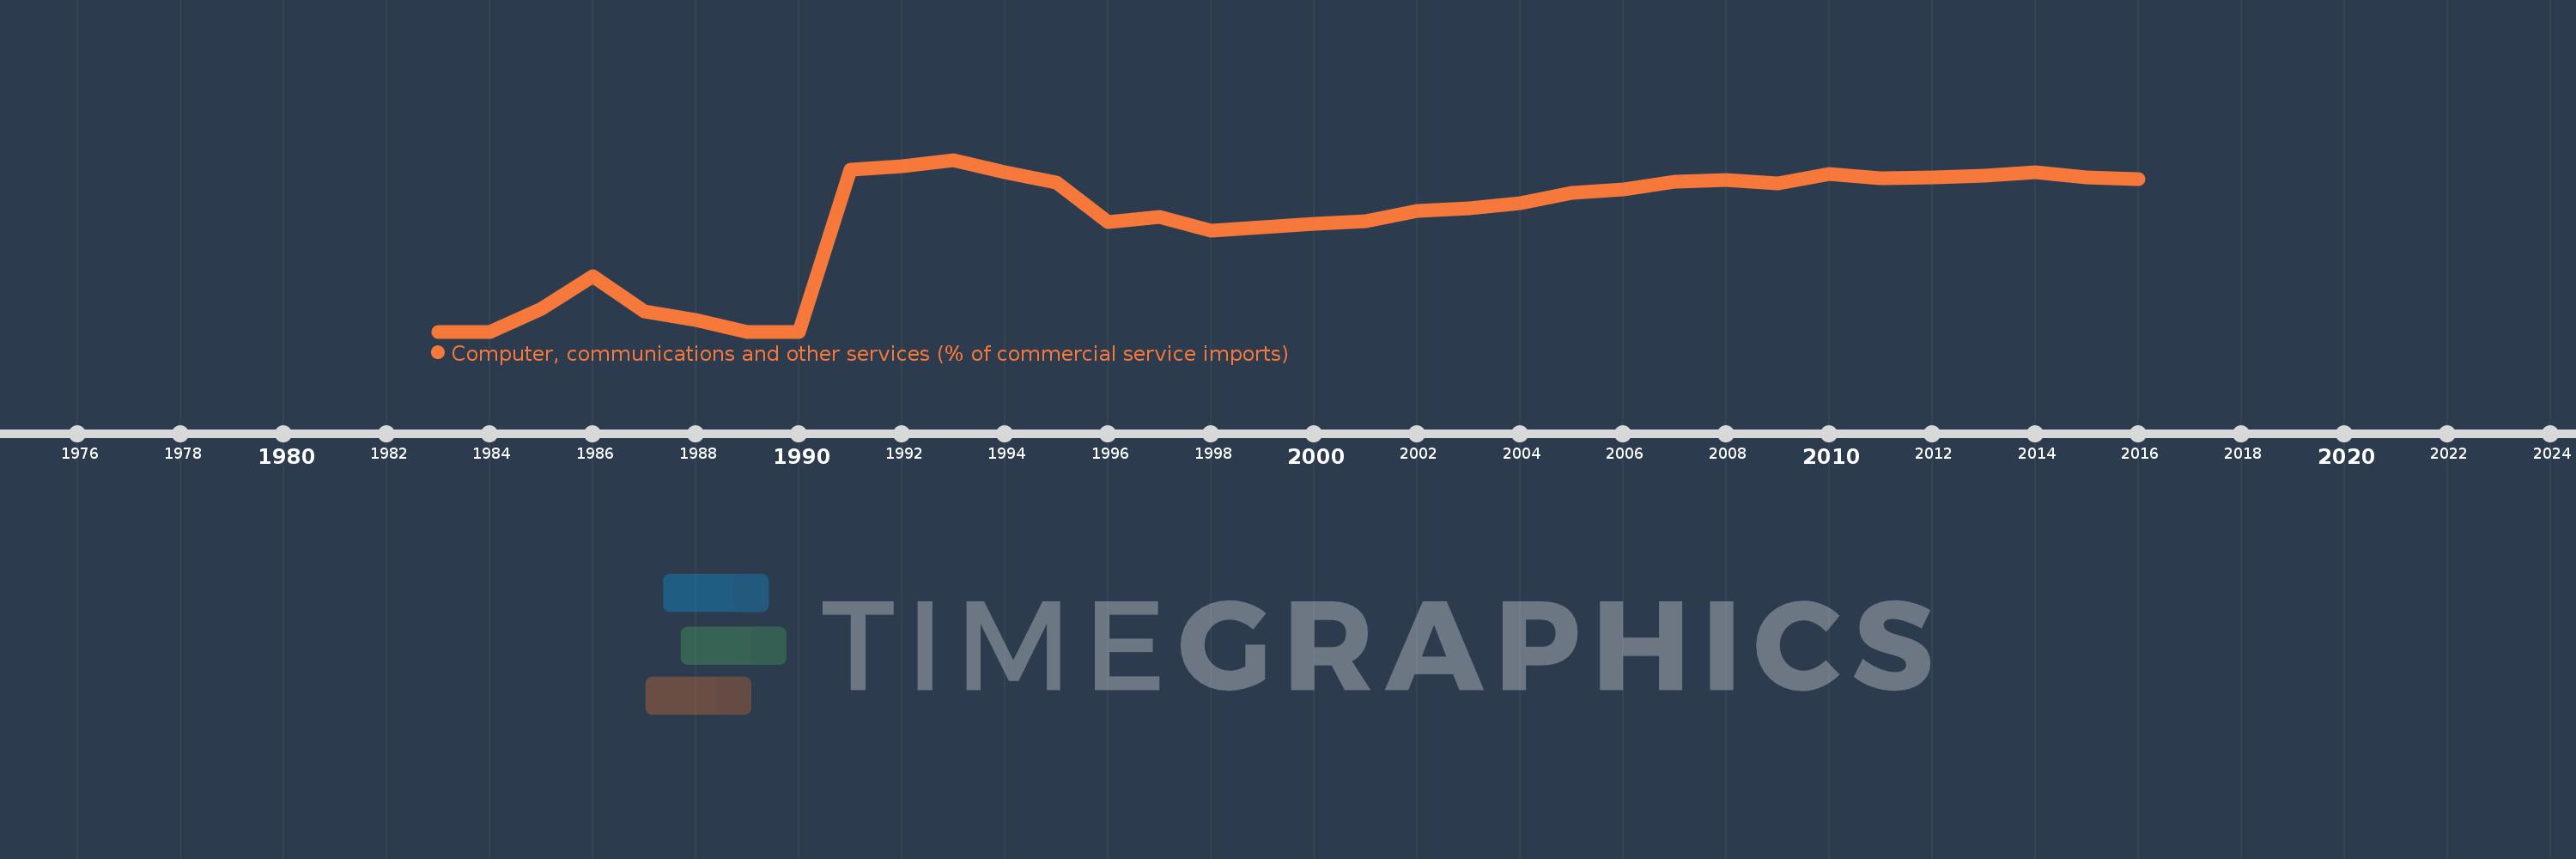
Computer, communications and other services (% of commercial service imports)
2016,2015,2014,2013,2012,2011,2010,2009,2008,2007,2006,2005,2004,2003,2002,2001,2000,1999,1998,1997,1996,1995,1994,1993,1992,1991,1990,1989,1988,1987,1986,1985,1984,1983
This statistics in other country:
AfghanistanAlbaniaAlgeriaAngolaAntigua and BarbudaArab WorldArgentinaArmeniaArubaAustraliaAustriaAzerbaijanBahamas, TheBahrainBangladeshBarbadosBelarusBelgiumBelizeBeninBermudaBhutanBoliviaBosnia and HerzegovinaBotswanaBrazilBrunei DarussalamBulgariaBurkina FasoBurundiCabo VerdeCambodiaCameroonCanadaCaribbean small statesCentral African RepublicCentral Europe and the BalticsChadChileChinaColombiaComorosCongo, Dem. Rep.Congo, Rep.Costa RicaCote d'IvoireCroatiaCuracaoCyprusCzech RepublicDenmarkDjiboutiDominicaDominican RepublicEarly-demographic dividendEast Asia & PacificEast Asia & Pacific (excluding high income)East Asia & Pacific (IDA & IBRD countries)EcuadorEgypt, Arab Rep.El SalvadorEquatorial GuineaEritreaEstoniaEthiopiaEuro areaEurope & Central AsiaEurope & Central Asia (excluding high income)Europe & Central Asia (IDA & IBRD countries)European UnionFaroe IslandsFijiFinlandFragile and conflict affected situationsFranceFrench PolynesiaGabonGambia, TheGeorgiaGermanyGhanaGreeceGrenadaGuatemalaGuineaGuinea-BissauGuyanaHaitiHeavily indebted poor countries (HIPC)High incomeHondurasHong Kong SAR, ChinaHungaryIBRD onlyIcelandIDA & IBRD totalIDA onlyIDA totalIndiaIndonesiaIran, Islamic Rep.IraqIrelandIsraelItalyJamaicaJapanJordanKazakhstanKenyaKiribatiKorea, Rep.KosovoKuwaitKyrgyz RepublicLao PDRLate-demographic dividendLatin America & Caribbean Latin America & Caribbean (excluding high income)Latin America & the Caribbean (IDA & IBRD countries)LatviaLeast developed countries: UN classificationLebanonLesothoLiberiaLibyaLithuaniaLow & middle incomeLow incomeLower middle incomeLuxembourgMacao SAR, ChinaMacedonia, FYRMadagascarMalawiMalaysiaMaldivesMaliMaltaMarshall IslandsMauritaniaMauritiusMexicoMicronesia, Fed. Sts.Middle East & North AfricaMiddle East & North Africa (excluding high income)Middle East & North Africa (IDA & IBRD countries)Middle incomeMoldovaMongoliaMontenegroMoroccoMozambiqueMyanmarNamibiaNepalNetherlandsNew CaledoniaNew ZealandNicaraguaNigerNigeriaNorth AmericaNorwayOECD membersOmanOther small statesPacific island small statesPakistanPalauPanamaPapua New GuineaParaguayPeruPhilippinesPolandPortugalPost-demographic dividendPre-demographic dividendQatarRomaniaRussian FederationRwandaSamoaSao Tome and PrincipeSaudi ArabiaSenegalSerbiaSeychellesSierra LeoneSingaporeSint Maarten (Dutch part)Slovak RepublicSloveniaSmall statesSolomon IslandsSouth AfricaSouth AsiaSouth Asia (IDA & IBRD)South SudanSpainSri LankaSt. Kitts and NevisSt. LuciaSt. Vincent and the GrenadinesSub-Saharan Africa Sub-Saharan Africa (excluding high income)Sub-Saharan Africa (IDA & IBRD countries)SudanSurinameSwazilandSwedenSwitzerlandSyrian Arab RepublicTajikistanTanzaniaThailandTimor-LesteTogoTongaTrinidad and TobagoTunisiaTurkeyTuvaluUgandaUkraineUnited KingdomUnited StatesUpper middle incomeUruguayVanuatuVenezuela, RBWest Bank and GazaWorldYemen, Rep.ZambiaZimbabwe Timeline:
This timeline shows a graph from 1983 to 2016 of Hungary. No data until 1982. Number of actual observations by date: 34.
Source name:
World Development Indicators
Source organization:
International Monetary Fund, Balance of Payments Statistics Yearbook and data files.
Categories, topics:
Private Sector, Trade
Last updated:
apr 23, 2017
Indicators value changes by year
Maximum:
68.391
jan 1, 1993
At the date of observation
Value
Absolute change
Change from previous value
jan 1, 1984
0.0
0.0
66.67%
jan 1, 1985
9.126
+9.126
-12843.96 trl%
jan 1, 1986
21.945
+12.819
140.46%
jan 1, 1987
7.93
-14.015
-63.86%
jan 1, 1988
4.725
-3.205
-40.42%
jan 1, 1989
0.0
-4.725
-100.0%
jan 1, 1990
0.0
0.0
-192.86%
jan 1, 1991
64.347
+64.347
-34831.08 trl%
jan 1, 1992
65.976
+1.629
2.53%
jan 1, 1993
68.391
+2.415
3.66%
jan 1, 1994
63.514
-4.876
-7.13%
jan 1, 1995
59.37
-4.144
-6.53%
jan 1, 1996
43.639
-15.731
-26.5%
jan 1, 1997
45.577
+1.938
4.44%
jan 1, 1998
40.345
-5.232
-11.48%
jan 1, 1999
41.717
+1.372
3.4%
jan 1, 2000
42.853
+1.137
2.72%
jan 1, 2001
43.976
+1.122
2.62%
jan 1, 2002
47.934
+3.958
9.0%
jan 1, 2003
49.046
+1.112
2.32%
jan 1, 2004
51.222
+2.176
4.44%
jan 1, 2005
55.18
+3.958
7.73%
jan 1, 2006
56.606
+1.426
2.58%
jan 1, 2007
59.671
+3.065
5.41%
jan 1, 2008
60.463
+0.792
1.33%
jan 1, 2009
58.971
-1.492
-2.47%
jan 1, 2010
62.643
+3.672
6.23%
jan 1, 2011
60.978
-1.665
-2.66%
jan 1, 2012
61.405
+0.427
0.7%
jan 1, 2013
62.002
+0.597
0.97%
jan 1, 2014
63.473
+1.471
2.37%
jan 1, 2015
61.493
-1.98
-3.12%
jan 1, 2016
60.725
-0.768
-1.25%
Ranking of countries by current statistics by years


Comments: