29
/
en
AIzaSyAYiBZKx7MnpbEhh9jyipgxe19OcubqV5w
April 1, 2024
233457
Sao Tome and Principe
STP
true
2
1
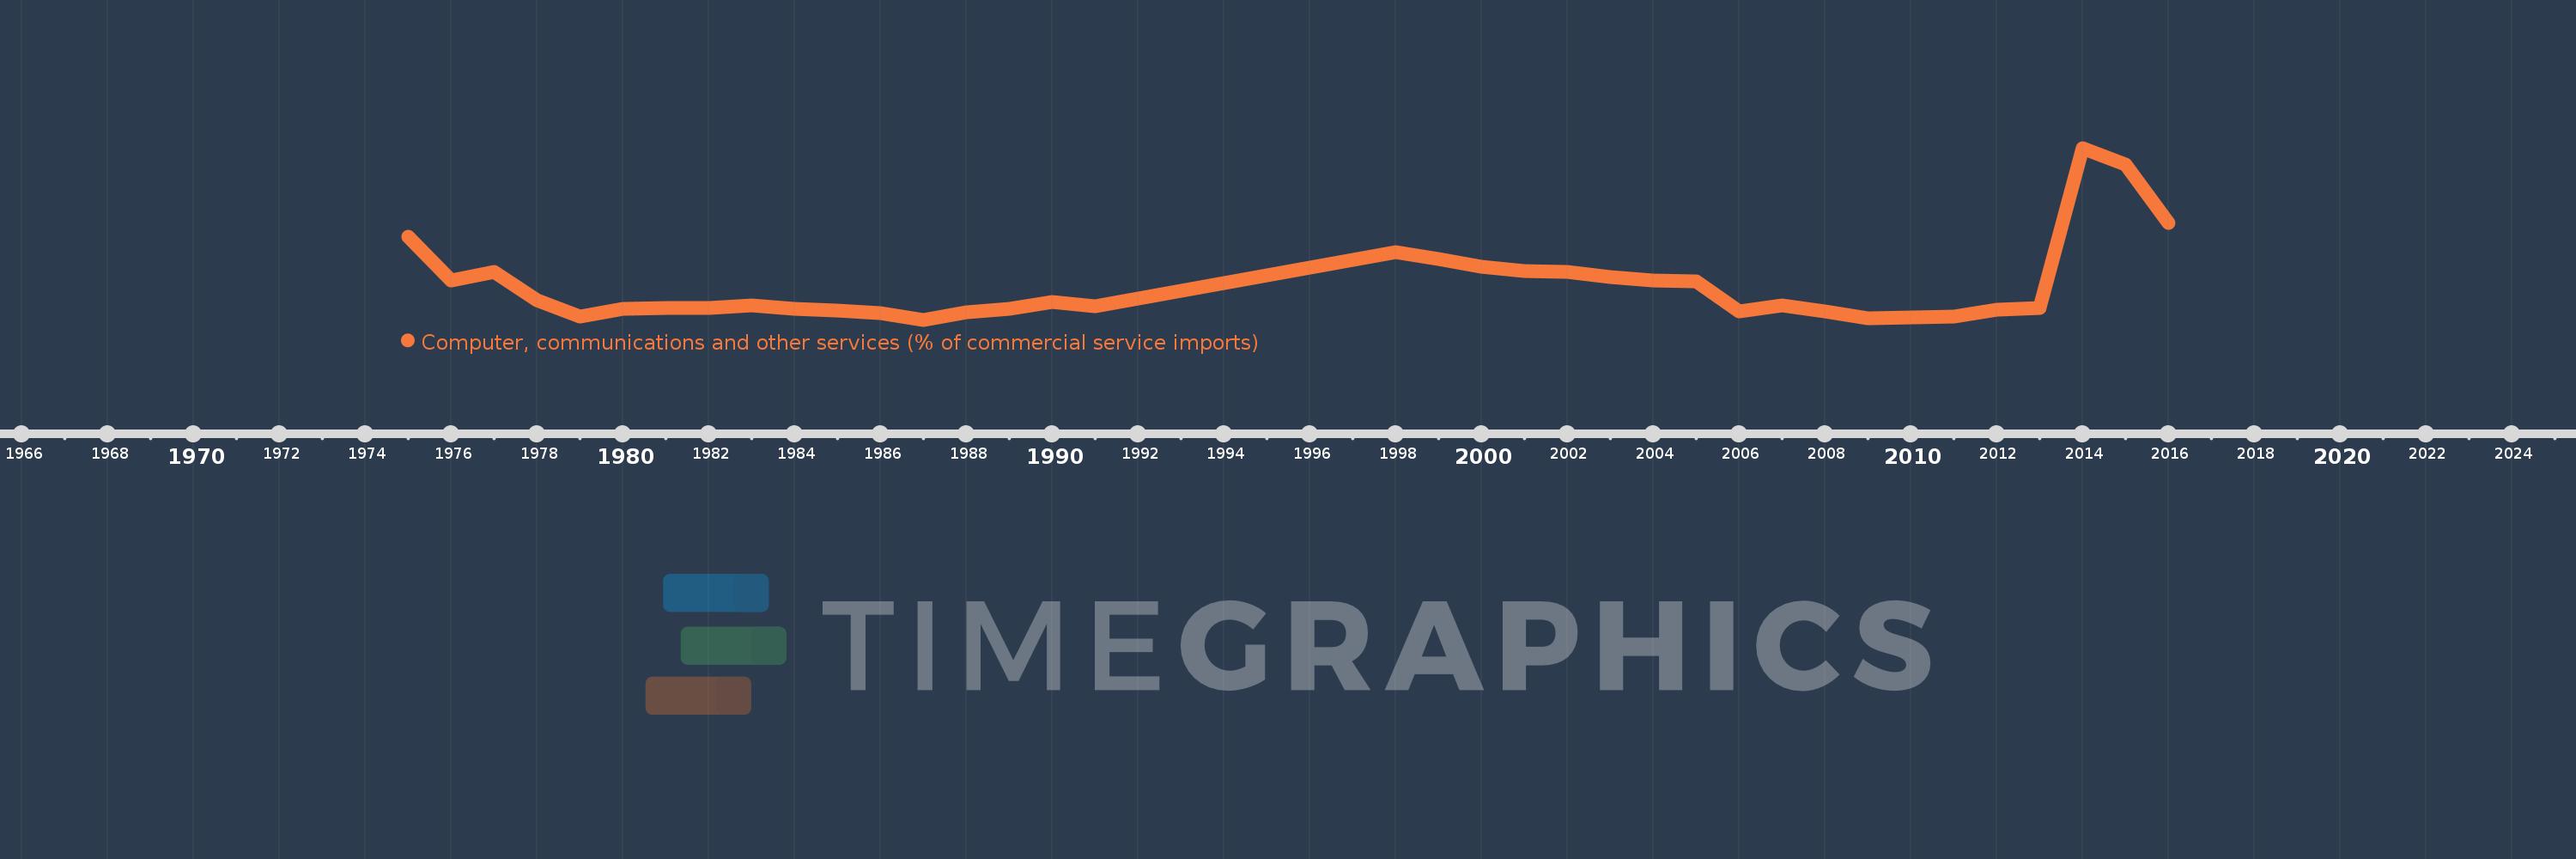
Computer, communications and other services (% of commercial service imports)
2016,2015,2014,2013,2012,2011,2010,2009,2008,2007,2006,2005,2004,2003,2002,2001,2000,1999,1998,1991,1990,1989,1988,1987,1986,1985,1984,1983,1982,1981,1980,1979,1978,1977,1976,1975
This statistics in other country:
AfghanistanAlbaniaAlgeriaAngolaAntigua and BarbudaArab WorldArgentinaArmeniaArubaAustraliaAustriaAzerbaijanBahamas, TheBahrainBangladeshBarbadosBelarusBelgiumBelizeBeninBermudaBhutanBoliviaBosnia and HerzegovinaBotswanaBrazilBrunei DarussalamBulgariaBurkina FasoBurundiCabo VerdeCambodiaCameroonCanadaCaribbean small statesCentral African RepublicCentral Europe and the BalticsChadChileChinaColombiaComorosCongo, Dem. Rep.Congo, Rep.Costa RicaCote d'IvoireCroatiaCuracaoCyprusCzech RepublicDenmarkDjiboutiDominicaDominican RepublicEarly-demographic dividendEast Asia & PacificEast Asia & Pacific (excluding high income)East Asia & Pacific (IDA & IBRD countries)EcuadorEgypt, Arab Rep.El SalvadorEquatorial GuineaEritreaEstoniaEthiopiaEuro areaEurope & Central AsiaEurope & Central Asia (excluding high income)Europe & Central Asia (IDA & IBRD countries)European UnionFaroe IslandsFijiFinlandFragile and conflict affected situationsFranceFrench PolynesiaGabonGambia, TheGeorgiaGermanyGhanaGreeceGrenadaGuatemalaGuineaGuinea-BissauGuyanaHaitiHeavily indebted poor countries (HIPC)High incomeHondurasHong Kong SAR, ChinaHungaryIBRD onlyIcelandIDA & IBRD totalIDA onlyIDA totalIndiaIndonesiaIran, Islamic Rep.IraqIrelandIsraelItalyJamaicaJapanJordanKazakhstanKenyaKiribatiKorea, Rep.KosovoKuwaitKyrgyz RepublicLao PDRLate-demographic dividendLatin America & Caribbean Latin America & Caribbean (excluding high income)Latin America & the Caribbean (IDA & IBRD countries)LatviaLeast developed countries: UN classificationLebanonLesothoLiberiaLibyaLithuaniaLow & middle incomeLow incomeLower middle incomeLuxembourgMacao SAR, ChinaMacedonia, FYRMadagascarMalawiMalaysiaMaldivesMaliMaltaMarshall IslandsMauritaniaMauritiusMexicoMicronesia, Fed. Sts.Middle East & North AfricaMiddle East & North Africa (excluding high income)Middle East & North Africa (IDA & IBRD countries)Middle incomeMoldovaMongoliaMontenegroMoroccoMozambiqueMyanmarNamibiaNepalNetherlandsNew CaledoniaNew ZealandNicaraguaNigerNigeriaNorth AmericaNorwayOECD membersOmanOther small statesPacific island small statesPakistanPalauPanamaPapua New GuineaParaguayPeruPhilippinesPolandPortugalPost-demographic dividendPre-demographic dividendQatarRomaniaRussian FederationRwandaSamoaSao Tome and PrincipeSaudi ArabiaSenegalSerbiaSeychellesSierra LeoneSingaporeSint Maarten (Dutch part)Slovak RepublicSloveniaSmall statesSolomon IslandsSouth AfricaSouth AsiaSouth Asia (IDA & IBRD)South SudanSpainSri LankaSt. Kitts and NevisSt. LuciaSt. Vincent and the GrenadinesSub-Saharan Africa Sub-Saharan Africa (excluding high income)Sub-Saharan Africa (IDA & IBRD countries)SudanSurinameSwazilandSwedenSwitzerlandSyrian Arab RepublicTajikistanTanzaniaThailandTimor-LesteTogoTongaTrinidad and TobagoTunisiaTurkeyTuvaluUgandaUkraineUnited KingdomUnited StatesUpper middle incomeUruguayVanuatuVenezuela, RBWest Bank and GazaWorldYemen, Rep.ZambiaZimbabwe Timeline:
This timeline shows a graph from 1975 to 2016 of Sao Tome and Principe. No data until 1974. Number of actual observations by date: 36.
Source name:
World Development Indicators
Source organization:
International Monetary Fund, Balance of Payments Statistics Yearbook and data files.
Categories, topics:
Private Sector, Trade
Last updated:
apr 23, 2017
Indicators value changes by year
At the date of observation
Value
Absolute change
Change from previous value
jan 1, 1975
23.25
+23.25
0.0%
jan 1, 1976
11.41
-11.84
-50.93%
jan 1, 1977
13.641
+2.231
19.56%
jan 1, 1978
5.878
-7.763
-56.91%
jan 1, 1979
1.525
-4.353
-74.05%
jan 1, 1980
3.447
+1.922
126.01%
jan 1, 1981
3.848
+0.401
11.64%
jan 1, 1982
3.713
-0.135
-3.51%
jan 1, 1983
4.568
+0.855
23.03%
jan 1, 1984
3.542
-1.026
-22.47%
jan 1, 1985
2.971
-0.571
-16.12%
jan 1, 1986
2.44
-0.531
-17.88%
jan 1, 1987
0.561
-1.879
-77.02%
jan 1, 1988
2.625
+2.065
368.3%
jan 1, 1989
3.46
+0.835
31.8%
jan 1, 1990
5.351
+1.891
54.65%
jan 1, 1991
4.135
-1.216
-22.72%
jan 1, 1998
19.153
+15.018
363.15%
jan 1, 1999
17.155
-1.998
-10.43%
jan 1, 2000
15.05
-2.104
-12.27%
jan 1, 2001
13.971
-1.079
-7.17%
jan 1, 2002
13.585
-0.386
-2.76%
jan 1, 2003
12.226
-1.359
-10.01%
jan 1, 2004
11.223
-1.003
-8.2%
jan 1, 2005
11.07
-0.152
-1.36%
jan 1, 2006
2.755
-8.315
-75.11%
jan 1, 2007
4.461
+1.706
61.92%
jan 1, 2008
2.928
-1.533
-34.37%
jan 1, 2009
1.066
-1.862
-63.59%
jan 1, 2010
1.258
+0.192
18.03%
jan 1, 2011
1.482
+0.224
17.81%
jan 1, 2012
3.237
+1.755
118.41%
jan 1, 2013
3.88
+0.643
19.85%
jan 1, 2014
47.57
+43.69
1.13K%
jan 1, 2015
43.149
-4.421
-9.29%
jan 1, 2016
27.089
-16.06
-37.22%
Ranking of countries by current statistics by years


Comments: