29
/
en
AIzaSyAYiBZKx7MnpbEhh9jyipgxe19OcubqV5w
April 1, 2024
140145
Ghana
GHA
true
2
1
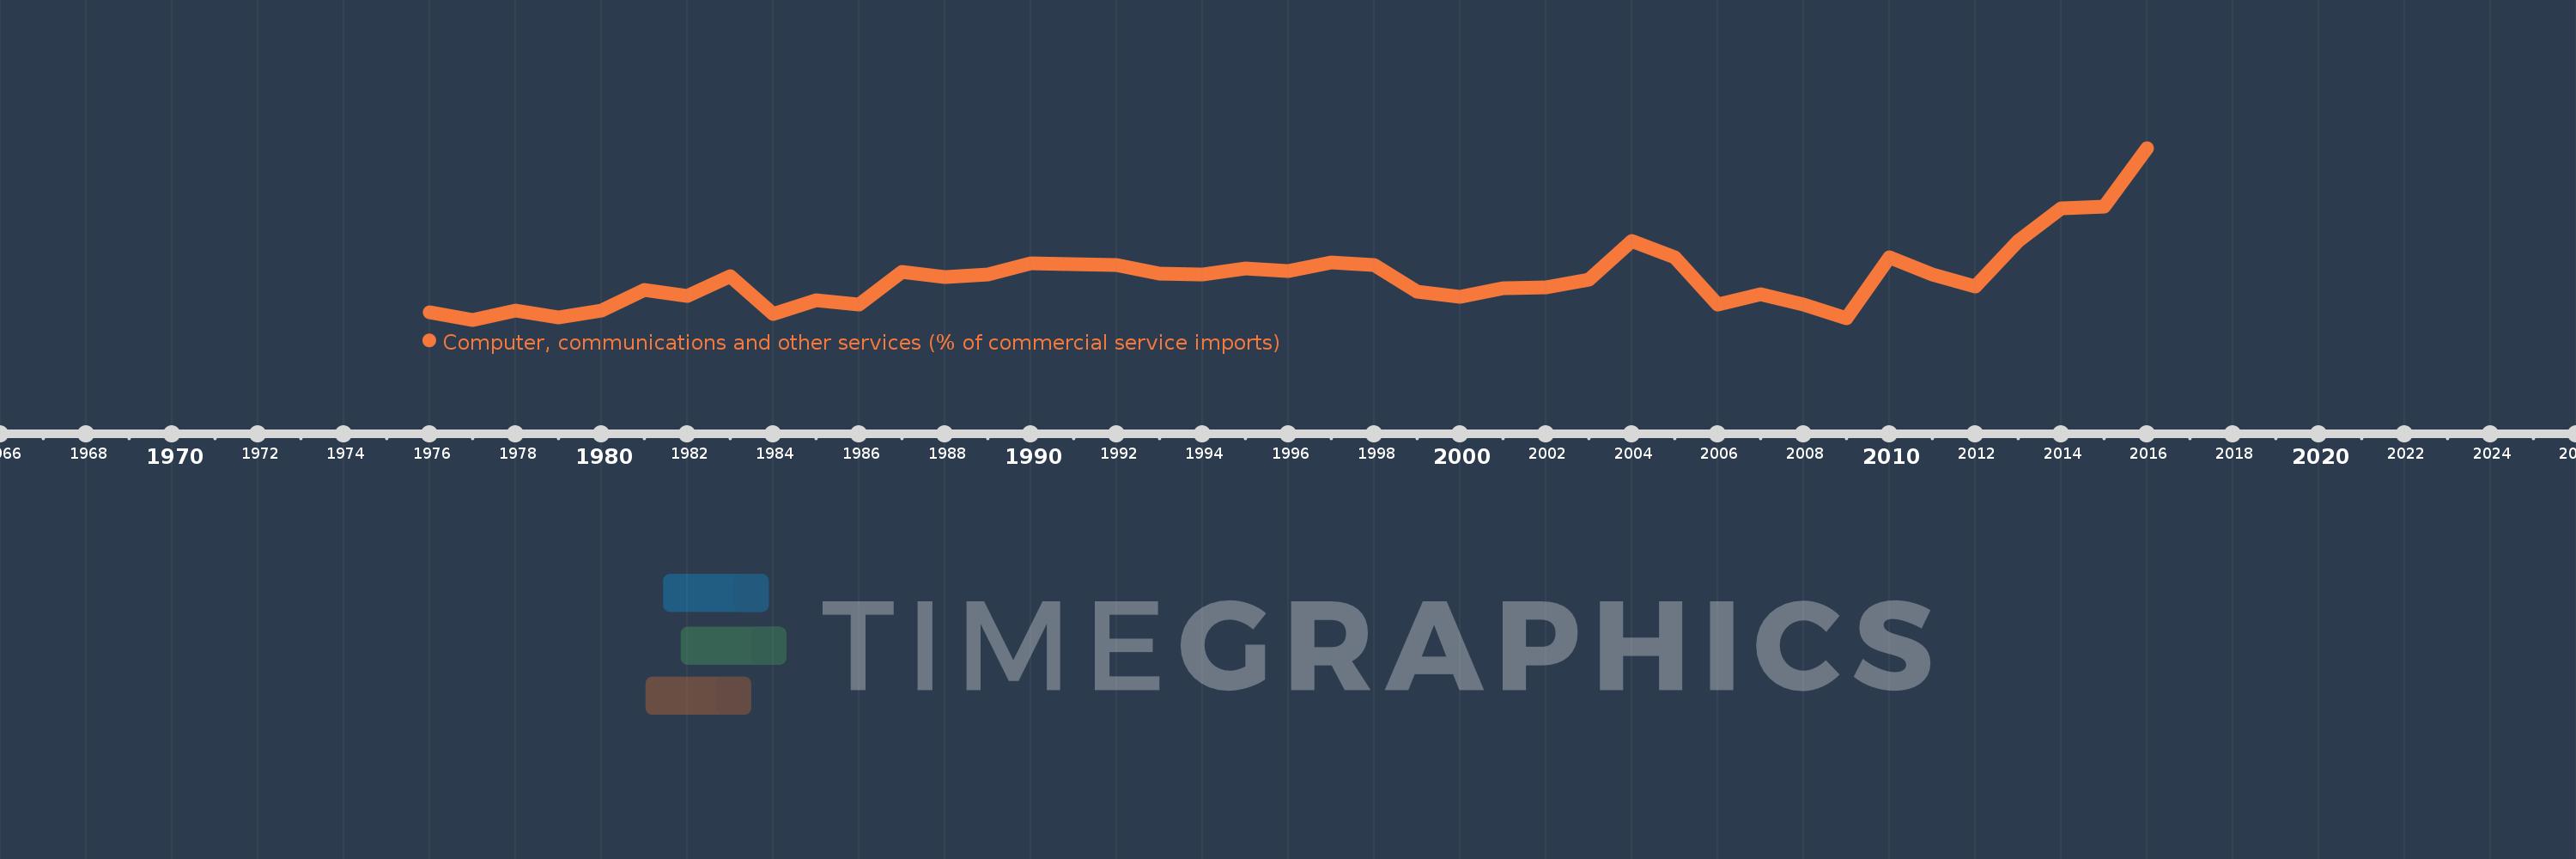
Computer, communications and other services (% of commercial service imports)
2016,2015,2014,2013,2012,2011,2010,2009,2008,2007,2006,2005,2004,2003,2002,2001,2000,1999,1998,1997,1996,1995,1994,1993,1992,1991,1990,1989,1988,1987,1986,1985,1984,1983,1982,1981,1980,1979,1978,1977,1976
This statistics in other country:
AfghanistanAlbaniaAlgeriaAngolaAntigua and BarbudaArab WorldArgentinaArmeniaArubaAustraliaAustriaAzerbaijanBahamas, TheBahrainBangladeshBarbadosBelarusBelgiumBelizeBeninBermudaBhutanBoliviaBosnia and HerzegovinaBotswanaBrazilBrunei DarussalamBulgariaBurkina FasoBurundiCabo VerdeCambodiaCameroonCanadaCaribbean small statesCentral African RepublicCentral Europe and the BalticsChadChileChinaColombiaComorosCongo, Dem. Rep.Congo, Rep.Costa RicaCote d'IvoireCroatiaCuracaoCyprusCzech RepublicDenmarkDjiboutiDominicaDominican RepublicEarly-demographic dividendEast Asia & PacificEast Asia & Pacific (excluding high income)East Asia & Pacific (IDA & IBRD countries)EcuadorEgypt, Arab Rep.El SalvadorEquatorial GuineaEritreaEstoniaEthiopiaEuro areaEurope & Central AsiaEurope & Central Asia (excluding high income)Europe & Central Asia (IDA & IBRD countries)European UnionFaroe IslandsFijiFinlandFragile and conflict affected situationsFranceFrench PolynesiaGabonGambia, TheGeorgiaGermanyGhanaGreeceGrenadaGuatemalaGuineaGuinea-BissauGuyanaHaitiHeavily indebted poor countries (HIPC)High incomeHondurasHong Kong SAR, ChinaHungaryIBRD onlyIcelandIDA & IBRD totalIDA onlyIDA totalIndiaIndonesiaIran, Islamic Rep.IraqIrelandIsraelItalyJamaicaJapanJordanKazakhstanKenyaKiribatiKorea, Rep.KosovoKuwaitKyrgyz RepublicLao PDRLate-demographic dividendLatin America & Caribbean Latin America & Caribbean (excluding high income)Latin America & the Caribbean (IDA & IBRD countries)LatviaLeast developed countries: UN classificationLebanonLesothoLiberiaLibyaLithuaniaLow & middle incomeLow incomeLower middle incomeLuxembourgMacao SAR, ChinaMacedonia, FYRMadagascarMalawiMalaysiaMaldivesMaliMaltaMarshall IslandsMauritaniaMauritiusMexicoMicronesia, Fed. Sts.Middle East & North AfricaMiddle East & North Africa (excluding high income)Middle East & North Africa (IDA & IBRD countries)Middle incomeMoldovaMongoliaMontenegroMoroccoMozambiqueMyanmarNamibiaNepalNetherlandsNew CaledoniaNew ZealandNicaraguaNigerNigeriaNorth AmericaNorwayOECD membersOmanOther small statesPacific island small statesPakistanPalauPanamaPapua New GuineaParaguayPeruPhilippinesPolandPortugalPost-demographic dividendPre-demographic dividendQatarRomaniaRussian FederationRwandaSamoaSao Tome and PrincipeSaudi ArabiaSenegalSerbiaSeychellesSierra LeoneSingaporeSint Maarten (Dutch part)Slovak RepublicSloveniaSmall statesSolomon IslandsSouth AfricaSouth AsiaSouth Asia (IDA & IBRD)South SudanSpainSri LankaSt. Kitts and NevisSt. LuciaSt. Vincent and the GrenadinesSub-Saharan Africa Sub-Saharan Africa (excluding high income)Sub-Saharan Africa (IDA & IBRD countries)SudanSurinameSwazilandSwedenSwitzerlandSyrian Arab RepublicTajikistanTanzaniaThailandTimor-LesteTogoTongaTrinidad and TobagoTunisiaTurkeyTuvaluUgandaUkraineUnited KingdomUnited StatesUpper middle incomeUruguayVanuatuVenezuela, RBWest Bank and GazaWorldYemen, Rep.ZambiaZimbabwe Timeline:
This timeline shows a graph from 1976 to 2016 of Ghana. No data until 1975. Number of actual observations by date: 41.
Source name:
World Development Indicators
Source organization:
International Monetary Fund, Balance of Payments Statistics Yearbook and data files.
Categories, topics:
Private Sector, Trade
Last updated:
apr 23, 2017
Indicators value changes by year
Minimum:
13.413
jan 1, 1977
Maximum:
58.141
jan 1, 2016
At the date of observation
Value
Absolute change
Change from previous value
jan 1, 1976
15.413
+15.413
0.0%
jan 1, 1977
13.413
-2.0
-12.97%
jan 1, 1978
15.876
+2.463
18.36%
jan 1, 1979
13.915
-1.961
-12.35%
jan 1, 1980
15.695
+1.78
12.79%
jan 1, 1981
21.186
+5.491
34.99%
jan 1, 1982
19.705
-1.481
-6.99%
jan 1, 1983
24.784
+5.079
25.78%
jan 1, 1984
14.896
-9.888
-39.9%
jan 1, 1985
18.431
+3.535
23.73%
jan 1, 1986
17.289
-1.141
-6.19%
jan 1, 1987
25.855
+8.566
49.54%
jan 1, 1988
24.492
-1.363
-5.27%
jan 1, 1989
25.294
+0.802
3.27%
jan 1, 1990
27.996
+2.703
10.68%
jan 1, 1991
27.793
-0.204
-0.73%
jan 1, 1992
27.639
-0.153
-0.55%
jan 1, 1993
25.479
-2.16
-7.81%
jan 1, 1994
25.211
-0.269
-1.05%
jan 1, 1995
26.708
+1.498
5.94%
jan 1, 1996
26.012
-0.696
-2.61%
jan 1, 1997
28.283
+2.271
8.73%
jan 1, 1998
27.65
-0.633
-2.24%
jan 1, 1999
20.705
-6.946
-25.12%
jan 1, 2000
19.391
-1.314
-6.35%
jan 1, 2001
21.725
+2.334
12.04%
jan 1, 2002
21.954
+0.229
1.05%
jan 1, 2003
23.81
+1.856
8.46%
jan 1, 2004
33.998
+10.188
42.79%
jan 1, 2005
29.722
-4.276
-12.58%
jan 1, 2006
17.459
-12.263
-41.26%
jan 1, 2007
19.962
+2.503
14.34%
jan 1, 2008
17.471
-2.491
-12.48%
jan 1, 2009
13.901
-3.57
-20.43%
jan 1, 2010
29.581
+15.68
112.79%
jan 1, 2011
25.264
-4.317
-14.59%
jan 1, 2012
22.076
-3.189
-12.62%
jan 1, 2013
33.956
+11.88
53.82%
jan 1, 2014
42.393
+8.437
24.85%
jan 1, 2015
42.88
+0.487
1.15%
jan 1, 2016
58.141
+15.26
35.59%
Ranking of countries by current statistics by years


Comments: