29
/
en
AIzaSyAYiBZKx7MnpbEhh9jyipgxe19OcubqV5w
April 1, 2024
52487
OECD members
OED
false
2
1
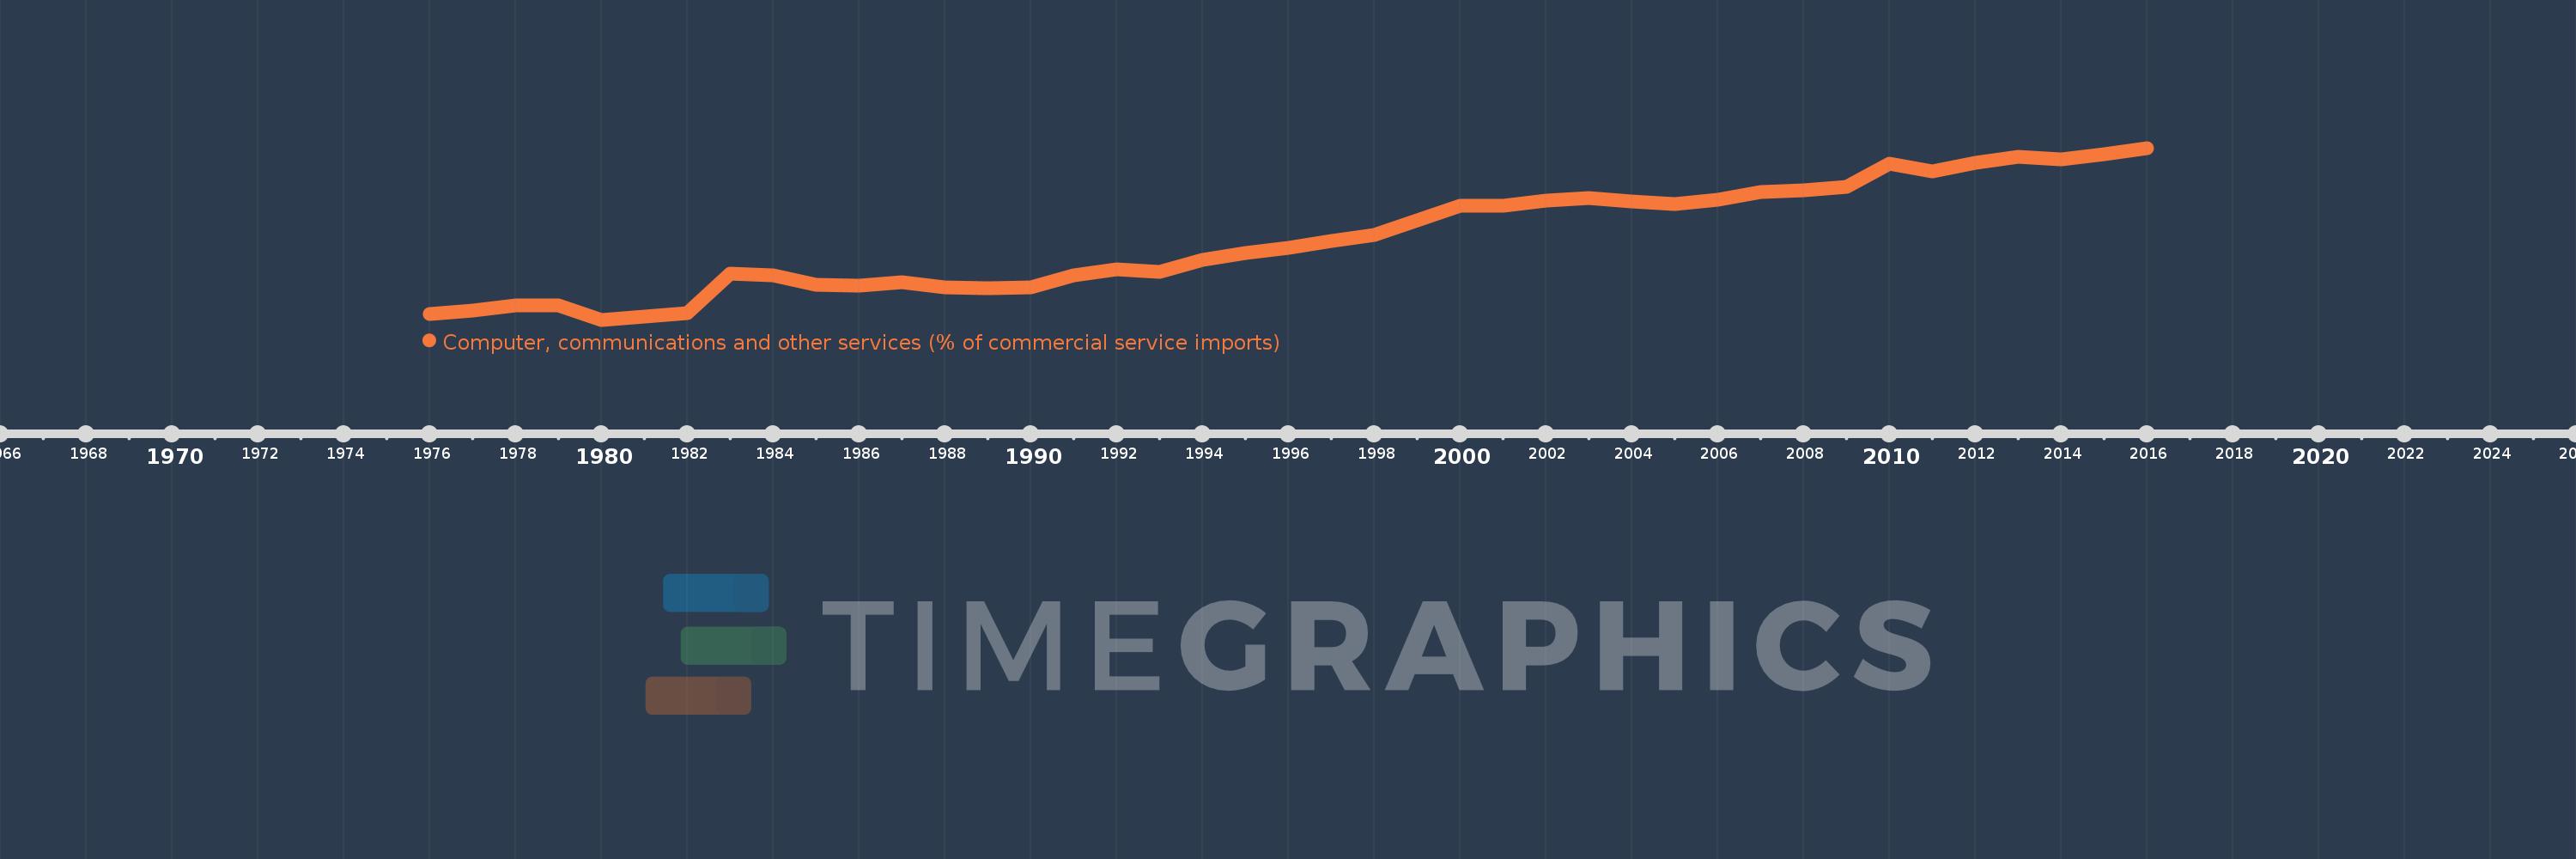
Computer, communications and other services (% of commercial service imports)
2016,2015,2014,2013,2012,2011,2010,2009,2008,2007,2006,2005,2004,2003,2002,2001,2000,1999,1998,1997,1996,1995,1994,1993,1992,1991,1990,1989,1988,1987,1986,1985,1984,1983,1982,1981,1980,1979,1978,1977,1976
This statistics in other country:
AfghanistanAlbaniaAlgeriaAngolaAntigua and BarbudaArab WorldArgentinaArmeniaArubaAustraliaAustriaAzerbaijanBahamas, TheBahrainBangladeshBarbadosBelarusBelgiumBelizeBeninBermudaBhutanBoliviaBosnia and HerzegovinaBotswanaBrazilBrunei DarussalamBulgariaBurkina FasoBurundiCabo VerdeCambodiaCameroonCanadaCaribbean small statesCentral African RepublicCentral Europe and the BalticsChadChileChinaColombiaComorosCongo, Dem. Rep.Congo, Rep.Costa RicaCote d'IvoireCroatiaCuracaoCyprusCzech RepublicDenmarkDjiboutiDominicaDominican RepublicEarly-demographic dividendEast Asia & PacificEast Asia & Pacific (excluding high income)East Asia & Pacific (IDA & IBRD countries)EcuadorEgypt, Arab Rep.El SalvadorEquatorial GuineaEritreaEstoniaEthiopiaEuro areaEurope & Central AsiaEurope & Central Asia (excluding high income)Europe & Central Asia (IDA & IBRD countries)European UnionFaroe IslandsFijiFinlandFragile and conflict affected situationsFranceFrench PolynesiaGabonGambia, TheGeorgiaGermanyGhanaGreeceGrenadaGuatemalaGuineaGuinea-BissauGuyanaHaitiHeavily indebted poor countries (HIPC)High incomeHondurasHong Kong SAR, ChinaHungaryIBRD onlyIcelandIDA & IBRD totalIDA onlyIDA totalIndiaIndonesiaIran, Islamic Rep.IraqIrelandIsraelItalyJamaicaJapanJordanKazakhstanKenyaKiribatiKorea, Rep.KosovoKuwaitKyrgyz RepublicLao PDRLate-demographic dividendLatin America & Caribbean Latin America & Caribbean (excluding high income)Latin America & the Caribbean (IDA & IBRD countries)LatviaLeast developed countries: UN classificationLebanonLesothoLiberiaLibyaLithuaniaLow & middle incomeLow incomeLower middle incomeLuxembourgMacao SAR, ChinaMacedonia, FYRMadagascarMalawiMalaysiaMaldivesMaliMaltaMarshall IslandsMauritaniaMauritiusMexicoMicronesia, Fed. Sts.Middle East & North AfricaMiddle East & North Africa (excluding high income)Middle East & North Africa (IDA & IBRD countries)Middle incomeMoldovaMongoliaMontenegroMoroccoMozambiqueMyanmarNamibiaNepalNetherlandsNew CaledoniaNew ZealandNicaraguaNigerNigeriaNorth AmericaNorwayOECD membersOmanOther small statesPacific island small statesPakistanPalauPanamaPapua New GuineaParaguayPeruPhilippinesPolandPortugalPost-demographic dividendPre-demographic dividendQatarRomaniaRussian FederationRwandaSamoaSao Tome and PrincipeSaudi ArabiaSenegalSerbiaSeychellesSierra LeoneSingaporeSint Maarten (Dutch part)Slovak RepublicSloveniaSmall statesSolomon IslandsSouth AfricaSouth AsiaSouth Asia (IDA & IBRD)South SudanSpainSri LankaSt. Kitts and NevisSt. LuciaSt. Vincent and the GrenadinesSub-Saharan Africa Sub-Saharan Africa (excluding high income)Sub-Saharan Africa (IDA & IBRD countries)SudanSurinameSwazilandSwedenSwitzerlandSyrian Arab RepublicTajikistanTanzaniaThailandTimor-LesteTogoTongaTrinidad and TobagoTunisiaTurkeyTuvaluUgandaUkraineUnited KingdomUnited StatesUpper middle incomeUruguayVanuatuVenezuela, RBWest Bank and GazaWorldYemen, Rep.ZambiaZimbabwe Timeline:
This timeline shows a graph from 1976 to 2016 of OECD members. No data until 1975. Number of actual observations by date: 41.
Source name:
World Development Indicators
Source organization:
International Monetary Fund, Balance of Payments Statistics Yearbook and data files.
Categories, topics:
Private Sector, Trade
Last updated:
apr 23, 2017
Indicators value changes by year
Minimum:
22.633
jan 1, 1980
Maximum:
45.663
jan 1, 2016
At the date of observation
Value
Absolute change
Change from previous value
jan 1, 1976
23.425
+23.425
0.0%
jan 1, 1977
23.893
+0.468
2.0%
jan 1, 1978
24.587
+0.694
2.91%
jan 1, 1979
24.503
-0.084
-0.34%
jan 1, 1980
22.633
-1.87
-7.63%
jan 1, 1981
23.11
+0.477
2.11%
jan 1, 1982
23.575
+0.464
2.01%
jan 1, 1983
28.816
+5.242
22.23%
jan 1, 1984
28.58
-0.236
-0.82%
jan 1, 1985
27.325
-1.255
-4.39%
jan 1, 1986
27.227
-0.098
-0.36%
jan 1, 1987
27.664
+0.437
1.61%
jan 1, 1988
26.934
-0.73
-2.64%
jan 1, 1989
26.806
-0.128
-0.48%
jan 1, 1990
26.947
+0.142
0.53%
jan 1, 1991
28.558
+1.61
5.98%
jan 1, 1992
29.393
+0.835
2.92%
jan 1, 1993
29.005
-0.388
-1.32%
jan 1, 1994
30.632
+1.627
5.61%
jan 1, 1995
31.575
+0.943
3.08%
jan 1, 1996
32.263
+0.689
2.18%
jan 1, 1997
33.155
+0.892
2.76%
jan 1, 1998
33.958
+0.803
2.42%
jan 1, 1999
35.919
+1.96
5.77%
jan 1, 2000
37.937
+2.019
5.62%
jan 1, 2001
37.903
-0.034
-0.09%
jan 1, 2002
38.55
+0.647
1.71%
jan 1, 2003
38.989
+0.439
1.14%
jan 1, 2004
38.509
-0.479
-1.23%
jan 1, 2005
38.148
-0.361
-0.94%
jan 1, 2006
38.708
+0.56
1.47%
jan 1, 2007
39.719
+1.012
2.61%
jan 1, 2008
39.957
+0.238
0.6%
jan 1, 2009
40.492
+0.534
1.34%
jan 1, 2010
43.562
+3.071
7.58%
jan 1, 2011
42.529
-1.033
-2.37%
jan 1, 2012
43.703
+1.173
2.76%
jan 1, 2013
44.457
+0.755
1.73%
jan 1, 2014
44.18
-0.278
-0.62%
jan 1, 2015
44.785
+0.605
1.37%
jan 1, 2016
45.663
+0.878
1.96%
Ranking of countries by current statistics by years


Comments: