29
/
en
AIzaSyAYiBZKx7MnpbEhh9jyipgxe19OcubqV5w
April 1, 2024
46951
Lower middle income
LMC
false
2
1
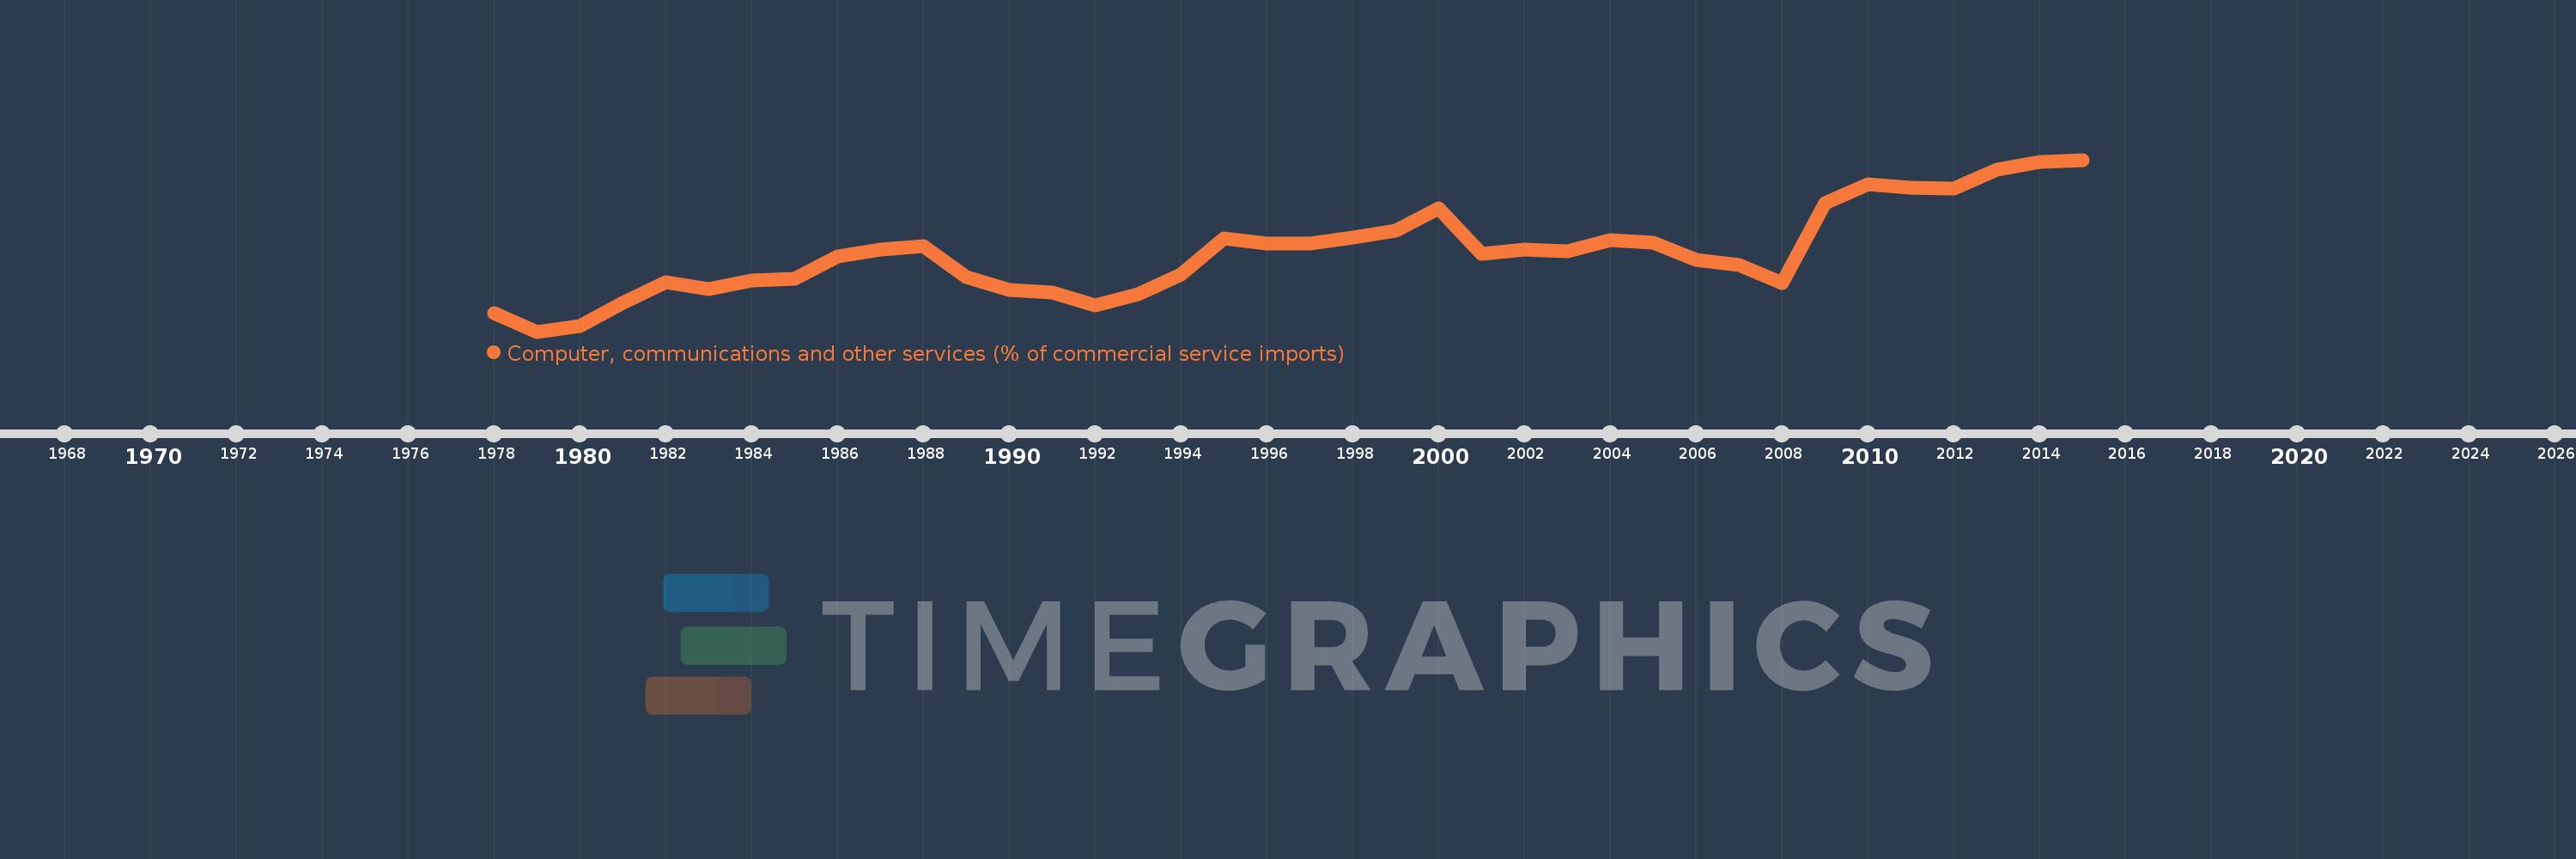
Computer, communications and other services (% of commercial service imports)
2015,2014,2013,2012,2011,2010,2009,2008,2007,2006,2005,2004,2003,2002,2001,2000,1999,1998,1997,1996,1995,1994,1993,1992,1991,1990,1989,1988,1987,1986,1985,1984,1983,1982,1981,1980,1979,1978
This statistics in other country:
AfghanistanAlbaniaAlgeriaAngolaAntigua and BarbudaArab WorldArgentinaArmeniaArubaAustraliaAustriaAzerbaijanBahamas, TheBahrainBangladeshBarbadosBelarusBelgiumBelizeBeninBermudaBhutanBoliviaBosnia and HerzegovinaBotswanaBrazilBrunei DarussalamBulgariaBurkina FasoBurundiCabo VerdeCambodiaCameroonCanadaCaribbean small statesCentral African RepublicCentral Europe and the BalticsChadChileChinaColombiaComorosCongo, Dem. Rep.Congo, Rep.Costa RicaCote d'IvoireCroatiaCuracaoCyprusCzech RepublicDenmarkDjiboutiDominicaDominican RepublicEarly-demographic dividendEast Asia & PacificEast Asia & Pacific (excluding high income)East Asia & Pacific (IDA & IBRD countries)EcuadorEgypt, Arab Rep.El SalvadorEquatorial GuineaEritreaEstoniaEthiopiaEuro areaEurope & Central AsiaEurope & Central Asia (excluding high income)Europe & Central Asia (IDA & IBRD countries)European UnionFaroe IslandsFijiFinlandFragile and conflict affected situationsFranceFrench PolynesiaGabonGambia, TheGeorgiaGermanyGhanaGreeceGrenadaGuatemalaGuineaGuinea-BissauGuyanaHaitiHeavily indebted poor countries (HIPC)High incomeHondurasHong Kong SAR, ChinaHungaryIBRD onlyIcelandIDA & IBRD totalIDA onlyIDA totalIndiaIndonesiaIran, Islamic Rep.IraqIrelandIsraelItalyJamaicaJapanJordanKazakhstanKenyaKiribatiKorea, Rep.KosovoKuwaitKyrgyz RepublicLao PDRLate-demographic dividendLatin America & Caribbean Latin America & Caribbean (excluding high income)Latin America & the Caribbean (IDA & IBRD countries)LatviaLeast developed countries: UN classificationLebanonLesothoLiberiaLibyaLithuaniaLow & middle incomeLow incomeLower middle incomeLuxembourgMacao SAR, ChinaMacedonia, FYRMadagascarMalawiMalaysiaMaldivesMaliMaltaMarshall IslandsMauritaniaMauritiusMexicoMicronesia, Fed. Sts.Middle East & North AfricaMiddle East & North Africa (excluding high income)Middle East & North Africa (IDA & IBRD countries)Middle incomeMoldovaMongoliaMontenegroMoroccoMozambiqueMyanmarNamibiaNepalNetherlandsNew CaledoniaNew ZealandNicaraguaNigerNigeriaNorth AmericaNorwayOECD membersOmanOther small statesPacific island small statesPakistanPalauPanamaPapua New GuineaParaguayPeruPhilippinesPolandPortugalPost-demographic dividendPre-demographic dividendQatarRomaniaRussian FederationRwandaSamoaSao Tome and PrincipeSaudi ArabiaSenegalSerbiaSeychellesSierra LeoneSingaporeSint Maarten (Dutch part)Slovak RepublicSloveniaSmall statesSolomon IslandsSouth AfricaSouth AsiaSouth Asia (IDA & IBRD)South SudanSpainSri LankaSt. Kitts and NevisSt. LuciaSt. Vincent and the GrenadinesSub-Saharan Africa Sub-Saharan Africa (excluding high income)Sub-Saharan Africa (IDA & IBRD countries)SudanSurinameSwazilandSwedenSwitzerlandSyrian Arab RepublicTajikistanTanzaniaThailandTimor-LesteTogoTongaTrinidad and TobagoTunisiaTurkeyTuvaluUgandaUkraineUnited KingdomUnited StatesUpper middle incomeUruguayVanuatuVenezuela, RBWest Bank and GazaWorldYemen, Rep.ZambiaZimbabwe Timeline:
This timeline shows a graph from 1978 to 2015 of Lower middle income. No data until 1977. Number of actual observations by date: 38.
Source name:
World Development Indicators
Source organization:
International Monetary Fund, Balance of Payments Statistics Yearbook and data files.
Categories, topics:
Private Sector, Trade
Last updated:
apr 23, 2017
Indicators value changes by year
Minimum:
23.881
jan 1, 1979
Maximum:
43.652
jan 1, 2015
At the date of observation
Value
Absolute change
Change from previous value
jan 1, 1978
25.983
+25.983
0.0%
jan 1, 1979
23.881
-2.102
-8.09%
jan 1, 1980
24.527
+0.647
2.71%
jan 1, 1981
27.205
+2.678
10.92%
jan 1, 1982
29.517
+2.311
8.5%
jan 1, 1983
28.732
-0.785
-2.66%
jan 1, 1984
29.715
+0.983
3.42%
jan 1, 1985
29.912
+0.197
0.66%
jan 1, 1986
32.518
+2.606
8.71%
jan 1, 1987
33.33
+0.812
2.5%
jan 1, 1988
33.702
+0.372
1.12%
jan 1, 1989
30.18
-3.522
-10.45%
jan 1, 1990
28.651
-1.529
-5.07%
jan 1, 1991
28.391
-0.26
-0.91%
jan 1, 1992
26.943
-1.448
-5.1%
jan 1, 1993
28.158
+1.216
4.51%
jan 1, 1994
30.41
+2.252
8.0%
jan 1, 1995
34.613
+4.203
13.82%
jan 1, 1996
34.055
-0.558
-1.61%
jan 1, 1997
34.061
+0.006
0.02%
jan 1, 1998
34.736
+0.675
1.98%
jan 1, 1999
35.48
+0.744
2.14%
jan 1, 2000
38.018
+2.538
7.15%
jan 1, 2001
32.845
-5.173
-13.61%
jan 1, 2002
33.276
+0.431
1.31%
jan 1, 2003
33.078
-0.198
-0.59%
jan 1, 2004
34.387
+1.309
3.96%
jan 1, 2005
34.139
-0.248
-0.72%
jan 1, 2006
32.109
-2.03
-5.95%
jan 1, 2007
31.515
-0.594
-1.85%
jan 1, 2008
29.433
-2.082
-6.6%
jan 1, 2009
38.643
+9.209
31.29%
jan 1, 2010
40.868
+2.225
5.76%
jan 1, 2011
40.482
-0.385
-0.94%
jan 1, 2012
40.358
-0.124
-0.31%
jan 1, 2013
42.485
+2.126
5.27%
jan 1, 2014
43.388
+0.903
2.13%
jan 1, 2015
43.652
+0.264
0.61%
Ranking of countries by current statistics by years


Comments: