29
/
en
AIzaSyAYiBZKx7MnpbEhh9jyipgxe19OcubqV5w
April 1, 2024
33308
European Union
EUU
false
2
1
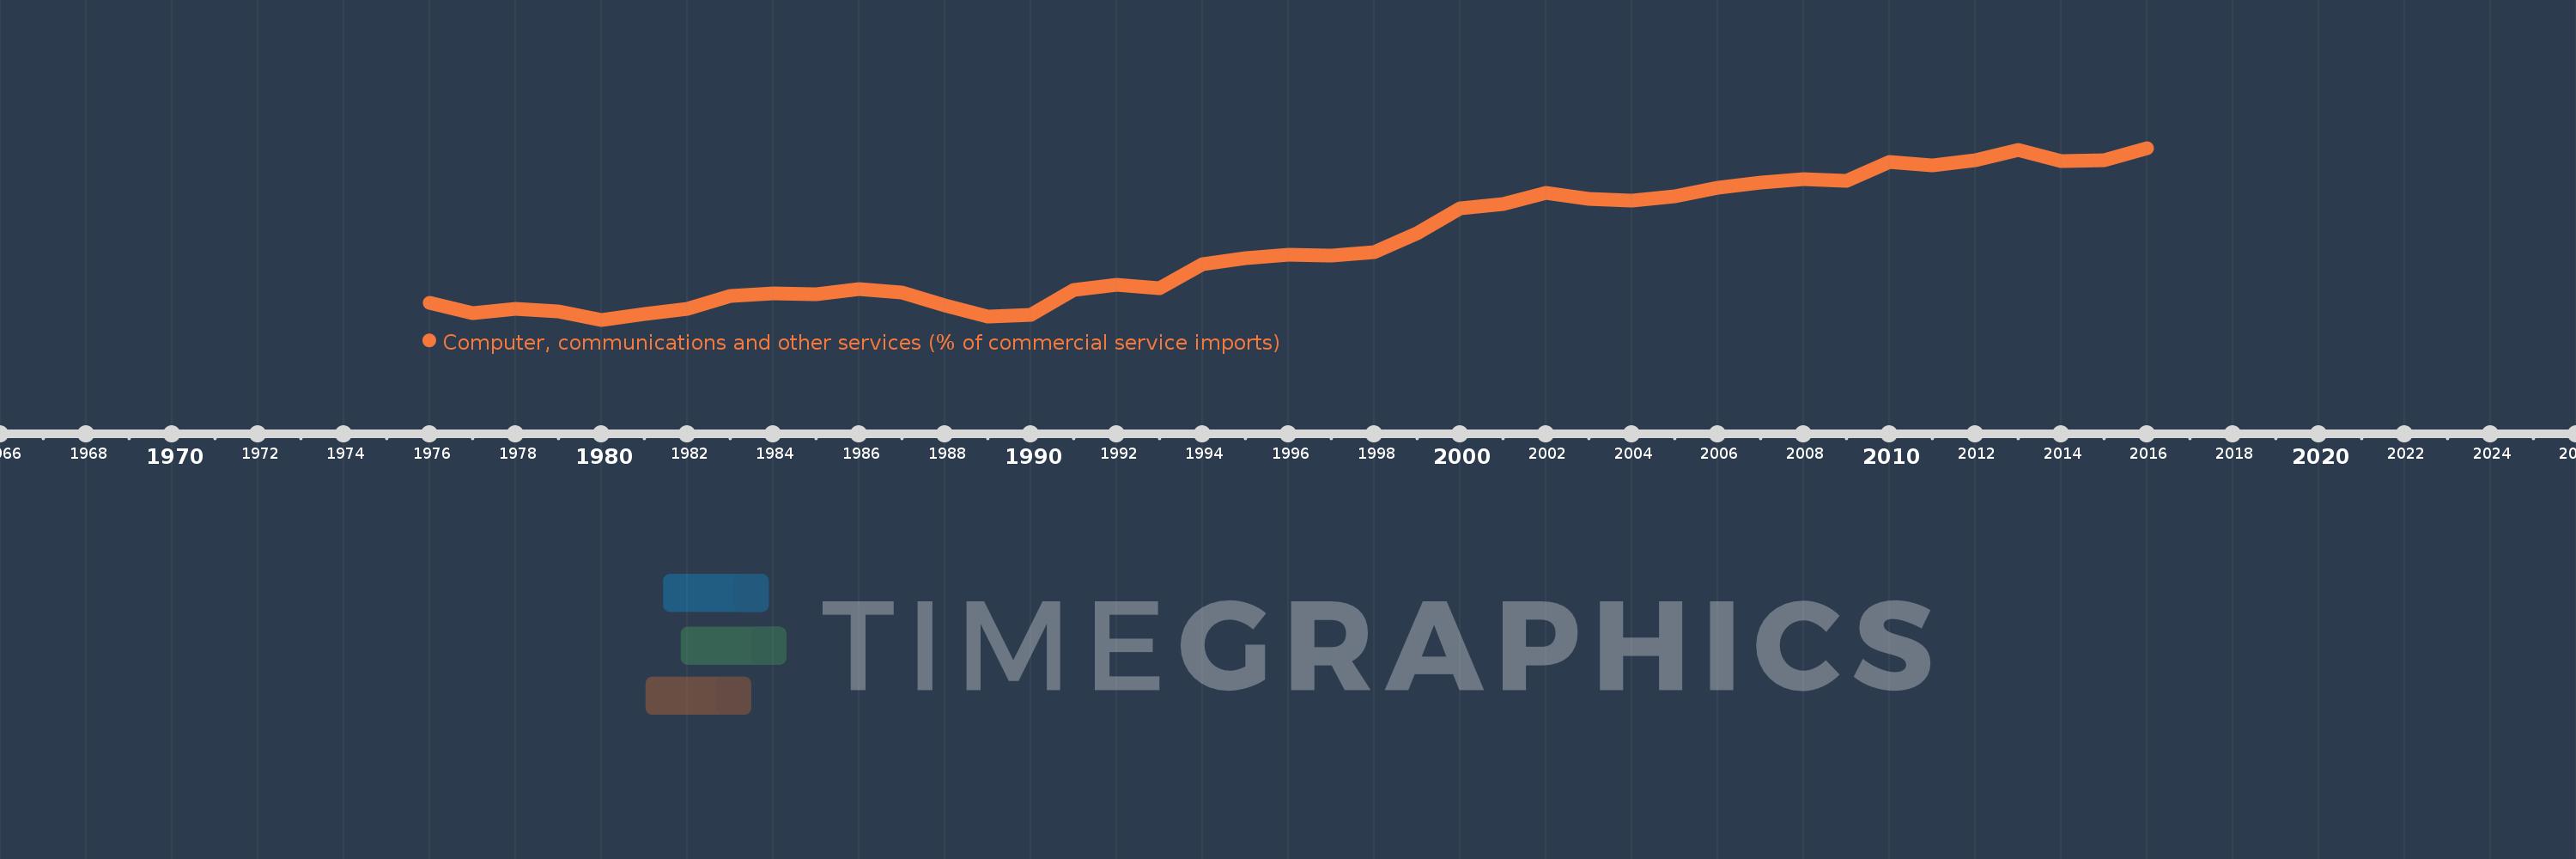
Computer, communications and other services (% of commercial service imports)
2016,2015,2014,2013,2012,2011,2010,2009,2008,2007,2006,2005,2004,2003,2002,2001,2000,1999,1998,1997,1996,1995,1994,1993,1992,1991,1990,1989,1988,1987,1986,1985,1984,1983,1982,1981,1980,1979,1978,1977,1976
This statistics in other country:
AfghanistanAlbaniaAlgeriaAngolaAntigua and BarbudaArab WorldArgentinaArmeniaArubaAustraliaAustriaAzerbaijanBahamas, TheBahrainBangladeshBarbadosBelarusBelgiumBelizeBeninBermudaBhutanBoliviaBosnia and HerzegovinaBotswanaBrazilBrunei DarussalamBulgariaBurkina FasoBurundiCabo VerdeCambodiaCameroonCanadaCaribbean small statesCentral African RepublicCentral Europe and the BalticsChadChileChinaColombiaComorosCongo, Dem. Rep.Congo, Rep.Costa RicaCote d'IvoireCroatiaCuracaoCyprusCzech RepublicDenmarkDjiboutiDominicaDominican RepublicEarly-demographic dividendEast Asia & PacificEast Asia & Pacific (excluding high income)East Asia & Pacific (IDA & IBRD countries)EcuadorEgypt, Arab Rep.El SalvadorEquatorial GuineaEritreaEstoniaEthiopiaEuro areaEurope & Central AsiaEurope & Central Asia (excluding high income)Europe & Central Asia (IDA & IBRD countries)European UnionFaroe IslandsFijiFinlandFragile and conflict affected situationsFranceFrench PolynesiaGabonGambia, TheGeorgiaGermanyGhanaGreeceGrenadaGuatemalaGuineaGuinea-BissauGuyanaHaitiHeavily indebted poor countries (HIPC)High incomeHondurasHong Kong SAR, ChinaHungaryIBRD onlyIcelandIDA & IBRD totalIDA onlyIDA totalIndiaIndonesiaIran, Islamic Rep.IraqIrelandIsraelItalyJamaicaJapanJordanKazakhstanKenyaKiribatiKorea, Rep.KosovoKuwaitKyrgyz RepublicLao PDRLate-demographic dividendLatin America & Caribbean Latin America & Caribbean (excluding high income)Latin America & the Caribbean (IDA & IBRD countries)LatviaLeast developed countries: UN classificationLebanonLesothoLiberiaLibyaLithuaniaLow & middle incomeLow incomeLower middle incomeLuxembourgMacao SAR, ChinaMacedonia, FYRMadagascarMalawiMalaysiaMaldivesMaliMaltaMarshall IslandsMauritaniaMauritiusMexicoMicronesia, Fed. Sts.Middle East & North AfricaMiddle East & North Africa (excluding high income)Middle East & North Africa (IDA & IBRD countries)Middle incomeMoldovaMongoliaMontenegroMoroccoMozambiqueMyanmarNamibiaNepalNetherlandsNew CaledoniaNew ZealandNicaraguaNigerNigeriaNorth AmericaNorwayOECD membersOmanOther small statesPacific island small statesPakistanPalauPanamaPapua New GuineaParaguayPeruPhilippinesPolandPortugalPost-demographic dividendPre-demographic dividendQatarRomaniaRussian FederationRwandaSamoaSao Tome and PrincipeSaudi ArabiaSenegalSerbiaSeychellesSierra LeoneSingaporeSint Maarten (Dutch part)Slovak RepublicSloveniaSmall statesSolomon IslandsSouth AfricaSouth AsiaSouth Asia (IDA & IBRD)South SudanSpainSri LankaSt. Kitts and NevisSt. LuciaSt. Vincent and the GrenadinesSub-Saharan Africa Sub-Saharan Africa (excluding high income)Sub-Saharan Africa (IDA & IBRD countries)SudanSurinameSwazilandSwedenSwitzerlandSyrian Arab RepublicTajikistanTanzaniaThailandTimor-LesteTogoTongaTrinidad and TobagoTunisiaTurkeyTuvaluUgandaUkraineUnited KingdomUnited StatesUpper middle incomeUruguayVanuatuVenezuela, RBWest Bank and GazaWorldYemen, Rep.ZambiaZimbabwe Timeline:
This timeline shows a graph from 1976 to 2016 of European Union. No data until 1975. Number of actual observations by date: 41.
Source name:
World Development Indicators
Source organization:
International Monetary Fund, Balance of Payments Statistics Yearbook and data files.
Categories, topics:
Private Sector, Trade
Last updated:
apr 23, 2017
Indicators value changes by year
Minimum:
28.565
jan 1, 1980
Maximum:
49.667
jan 1, 2016
At the date of observation
Value
Absolute change
Change from previous value
jan 1, 1976
30.691
+30.691
0.0%
jan 1, 1977
29.425
-1.266
-4.12%
jan 1, 1978
29.886
+0.462
1.57%
jan 1, 1979
29.583
-0.303
-1.01%
jan 1, 1980
28.565
-1.018
-3.44%
jan 1, 1981
29.221
+0.655
2.29%
jan 1, 1982
29.928
+0.707
2.42%
jan 1, 1983
31.516
+1.588
5.3%
jan 1, 1984
31.805
+0.29
0.92%
jan 1, 1985
31.691
-0.114
-0.36%
jan 1, 1986
32.356
+0.665
2.1%
jan 1, 1987
31.875
-0.481
-1.49%
jan 1, 1988
30.278
-1.597
-5.01%
jan 1, 1989
28.981
-1.298
-4.29%
jan 1, 1990
29.15
+0.169
0.58%
jan 1, 1991
32.199
+3.049
10.46%
jan 1, 1992
32.814
+0.615
1.91%
jan 1, 1993
32.453
-0.361
-1.1%
jan 1, 1994
35.356
+2.903
8.95%
jan 1, 1995
36.111
+0.755
2.14%
jan 1, 1996
36.543
+0.432
1.2%
jan 1, 1997
36.408
-0.135
-0.37%
jan 1, 1998
36.858
+0.45
1.24%
jan 1, 1999
39.221
+2.362
6.41%
jan 1, 2000
42.234
+3.013
7.68%
jan 1, 2001
42.801
+0.567
1.34%
jan 1, 2002
44.143
+1.342
3.14%
jan 1, 2003
43.451
-0.692
-1.57%
jan 1, 2004
43.23
-0.221
-0.51%
jan 1, 2005
43.724
+0.493
1.14%
jan 1, 2006
44.781
+1.058
2.42%
jan 1, 2007
45.4
+0.618
1.38%
jan 1, 2008
45.812
+0.412
0.91%
jan 1, 2009
45.598
-0.214
-0.47%
jan 1, 2010
47.991
+2.394
5.25%
jan 1, 2011
47.523
-0.468
-0.98%
jan 1, 2012
48.195
+0.672
1.41%
jan 1, 2013
49.408
+1.213
2.52%
jan 1, 2014
48.017
-1.391
-2.81%
jan 1, 2015
48.168
+0.151
0.31%
jan 1, 2016
49.667
+1.498
3.11%
Ranking of countries by current statistics by years


Comments: