29
/
en
AIzaSyAYiBZKx7MnpbEhh9jyipgxe19OcubqV5w
April 1, 2024
191235
Malta
MLT
true
2
1
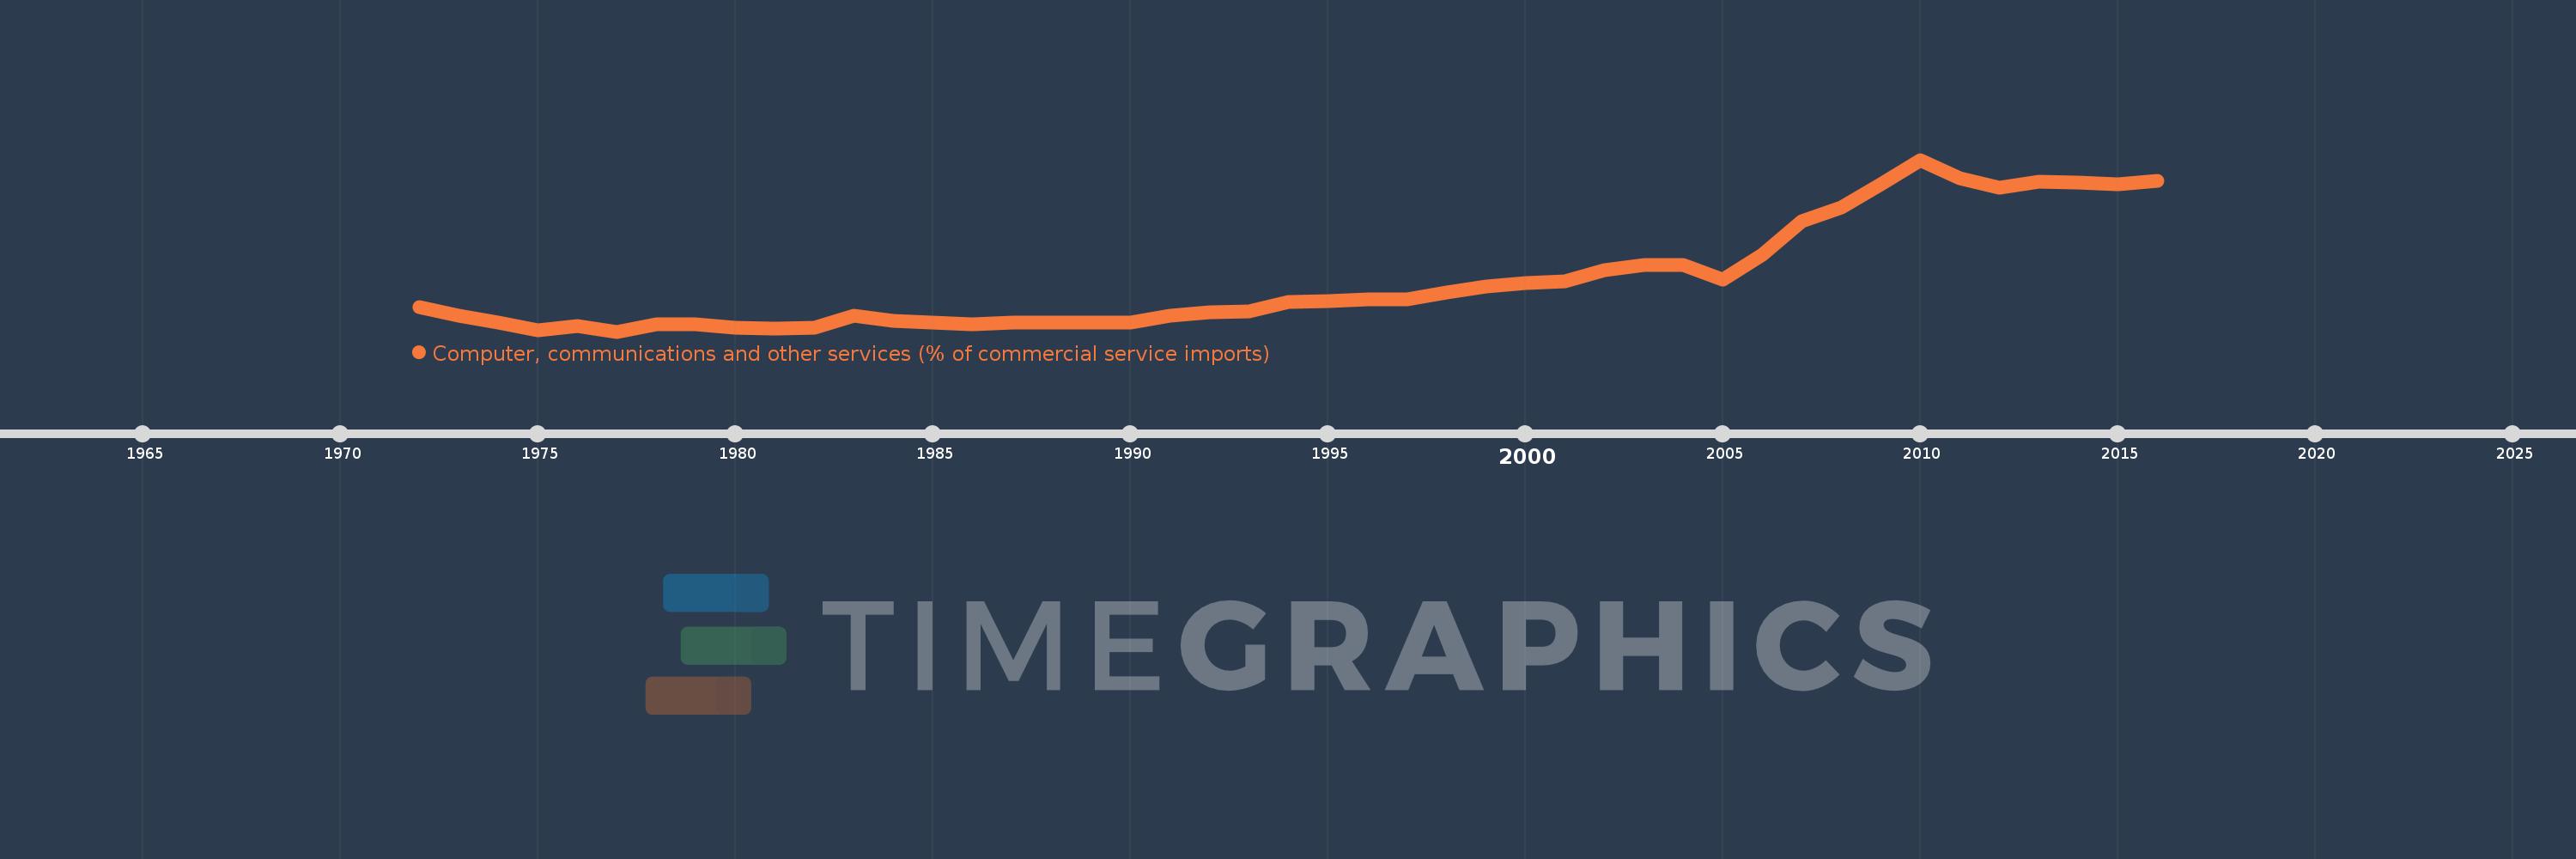
Computer, communications and other services (% of commercial service imports)
2016,2015,2014,2013,2012,2011,2010,2009,2008,2007,2006,2005,2004,2003,2002,2001,2000,1999,1998,1997,1996,1995,1994,1993,1992,1991,1990,1989,1988,1987,1986,1985,1984,1983,1982,1981,1980,1979,1978,1977,1976,1975,1974,1973,1972
This statistics in other country:
AfghanistanAlbaniaAlgeriaAngolaAntigua and BarbudaArab WorldArgentinaArmeniaArubaAustraliaAustriaAzerbaijanBahamas, TheBahrainBangladeshBarbadosBelarusBelgiumBelizeBeninBermudaBhutanBoliviaBosnia and HerzegovinaBotswanaBrazilBrunei DarussalamBulgariaBurkina FasoBurundiCabo VerdeCambodiaCameroonCanadaCaribbean small statesCentral African RepublicCentral Europe and the BalticsChadChileChinaColombiaComorosCongo, Dem. Rep.Congo, Rep.Costa RicaCote d'IvoireCroatiaCuracaoCyprusCzech RepublicDenmarkDjiboutiDominicaDominican RepublicEarly-demographic dividendEast Asia & PacificEast Asia & Pacific (excluding high income)East Asia & Pacific (IDA & IBRD countries)EcuadorEgypt, Arab Rep.El SalvadorEquatorial GuineaEritreaEstoniaEthiopiaEuro areaEurope & Central AsiaEurope & Central Asia (excluding high income)Europe & Central Asia (IDA & IBRD countries)European UnionFaroe IslandsFijiFinlandFragile and conflict affected situationsFranceFrench PolynesiaGabonGambia, TheGeorgiaGermanyGhanaGreeceGrenadaGuatemalaGuineaGuinea-BissauGuyanaHaitiHeavily indebted poor countries (HIPC)High incomeHondurasHong Kong SAR, ChinaHungaryIBRD onlyIcelandIDA & IBRD totalIDA onlyIDA totalIndiaIndonesiaIran, Islamic Rep.IraqIrelandIsraelItalyJamaicaJapanJordanKazakhstanKenyaKiribatiKorea, Rep.KosovoKuwaitKyrgyz RepublicLao PDRLate-demographic dividendLatin America & Caribbean Latin America & Caribbean (excluding high income)Latin America & the Caribbean (IDA & IBRD countries)LatviaLeast developed countries: UN classificationLebanonLesothoLiberiaLibyaLithuaniaLow & middle incomeLow incomeLower middle incomeLuxembourgMacao SAR, ChinaMacedonia, FYRMadagascarMalawiMalaysiaMaldivesMaliMaltaMarshall IslandsMauritaniaMauritiusMexicoMicronesia, Fed. Sts.Middle East & North AfricaMiddle East & North Africa (excluding high income)Middle East & North Africa (IDA & IBRD countries)Middle incomeMoldovaMongoliaMontenegroMoroccoMozambiqueMyanmarNamibiaNepalNetherlandsNew CaledoniaNew ZealandNicaraguaNigerNigeriaNorth AmericaNorwayOECD membersOmanOther small statesPacific island small statesPakistanPalauPanamaPapua New GuineaParaguayPeruPhilippinesPolandPortugalPost-demographic dividendPre-demographic dividendQatarRomaniaRussian FederationRwandaSamoaSao Tome and PrincipeSaudi ArabiaSenegalSerbiaSeychellesSierra LeoneSingaporeSint Maarten (Dutch part)Slovak RepublicSloveniaSmall statesSolomon IslandsSouth AfricaSouth AsiaSouth Asia (IDA & IBRD)South SudanSpainSri LankaSt. Kitts and NevisSt. LuciaSt. Vincent and the GrenadinesSub-Saharan Africa Sub-Saharan Africa (excluding high income)Sub-Saharan Africa (IDA & IBRD countries)SudanSurinameSwazilandSwedenSwitzerlandSyrian Arab RepublicTajikistanTanzaniaThailandTimor-LesteTogoTongaTrinidad and TobagoTunisiaTurkeyTuvaluUgandaUkraineUnited KingdomUnited StatesUpper middle incomeUruguayVanuatuVenezuela, RBWest Bank and GazaWorldYemen, Rep.ZambiaZimbabwe Timeline:
This timeline shows a graph from 1972 to 2016 of Malta. No data until 1971. Number of actual observations by date: 45.
Source name:
World Development Indicators
Source organization:
International Monetary Fund, Balance of Payments Statistics Yearbook and data files.
Categories, topics:
Private Sector, Trade
Last updated:
apr 23, 2017
Indicators value changes by year
Maximum:
62.599
jan 1, 2010
At the date of observation
Value
Absolute change
Change from previous value
jan 1, 1972
13.415
+13.415
0.0%
jan 1, 1973
10.303
-3.112
-23.2%
jan 1, 1974
8.065
-2.239
-21.73%
jan 1, 1975
5.639
-2.425
-30.08%
jan 1, 1976
6.977
+1.338
23.72%
jan 1, 1977
5.128
-1.849
-26.5%
jan 1, 1978
7.463
+2.334
45.52%
jan 1, 1979
7.605
+0.142
1.9%
jan 1, 1980
6.562
-1.042
-13.7%
jan 1, 1981
6.188
-0.374
-5.7%
jan 1, 1982
6.469
+0.281
4.54%
jan 1, 1983
10.548
+4.078
63.04%
jan 1, 1984
8.676
-1.872
-17.75%
jan 1, 1985
8.034
-0.642
-7.4%
jan 1, 1986
7.46
-0.574
-7.15%
jan 1, 1987
8.116
+0.656
8.79%
jan 1, 1988
8.113
-0.003
-0.04%
jan 1, 1989
8.039
-0.074
-0.91%
jan 1, 1990
8.127
+0.088
1.09%
jan 1, 1991
10.39
+2.263
27.85%
jan 1, 1992
11.61
+1.22
11.74%
jan 1, 1993
11.98
+0.37
3.19%
jan 1, 1994
15.157
+3.177
26.52%
jan 1, 1995
15.297
+0.14
0.92%
jan 1, 1996
16.022
+0.725
4.74%
jan 1, 1997
15.922
-0.1
-0.62%
jan 1, 1998
18.125
+2.203
13.84%
jan 1, 1999
20.157
+2.032
11.21%
jan 1, 2000
21.354
+1.197
5.94%
jan 1, 2001
22.036
+0.682
3.19%
jan 1, 2002
25.66
+3.625
16.45%
jan 1, 2003
27.365
+1.705
6.64%
jan 1, 2004
27.404
+0.039
0.14%
jan 1, 2005
22.449
-4.956
-18.08%
jan 1, 2006
30.807
+8.359
37.23%
jan 1, 2007
42.017
+11.209
36.39%
jan 1, 2008
46.696
+4.68
11.14%
jan 1, 2009
54.501
+7.804
16.71%
jan 1, 2010
62.599
+8.098
14.86%
jan 1, 2011
56.289
-6.309
-10.08%
jan 1, 2012
53.39
-2.899
-5.15%
jan 1, 2013
55.286
+1.896
3.55%
jan 1, 2014
54.901
-0.385
-0.7%
jan 1, 2015
54.47
-0.431
-0.79%
jan 1, 2016
55.54
+1.071
1.97%
Ranking of countries by current statistics by years


Comments: