29
/
en
AIzaSyAYiBZKx7MnpbEhh9jyipgxe19OcubqV5w
April 1, 2024
146668
Guinea-Bissau
GNB
true
2
1
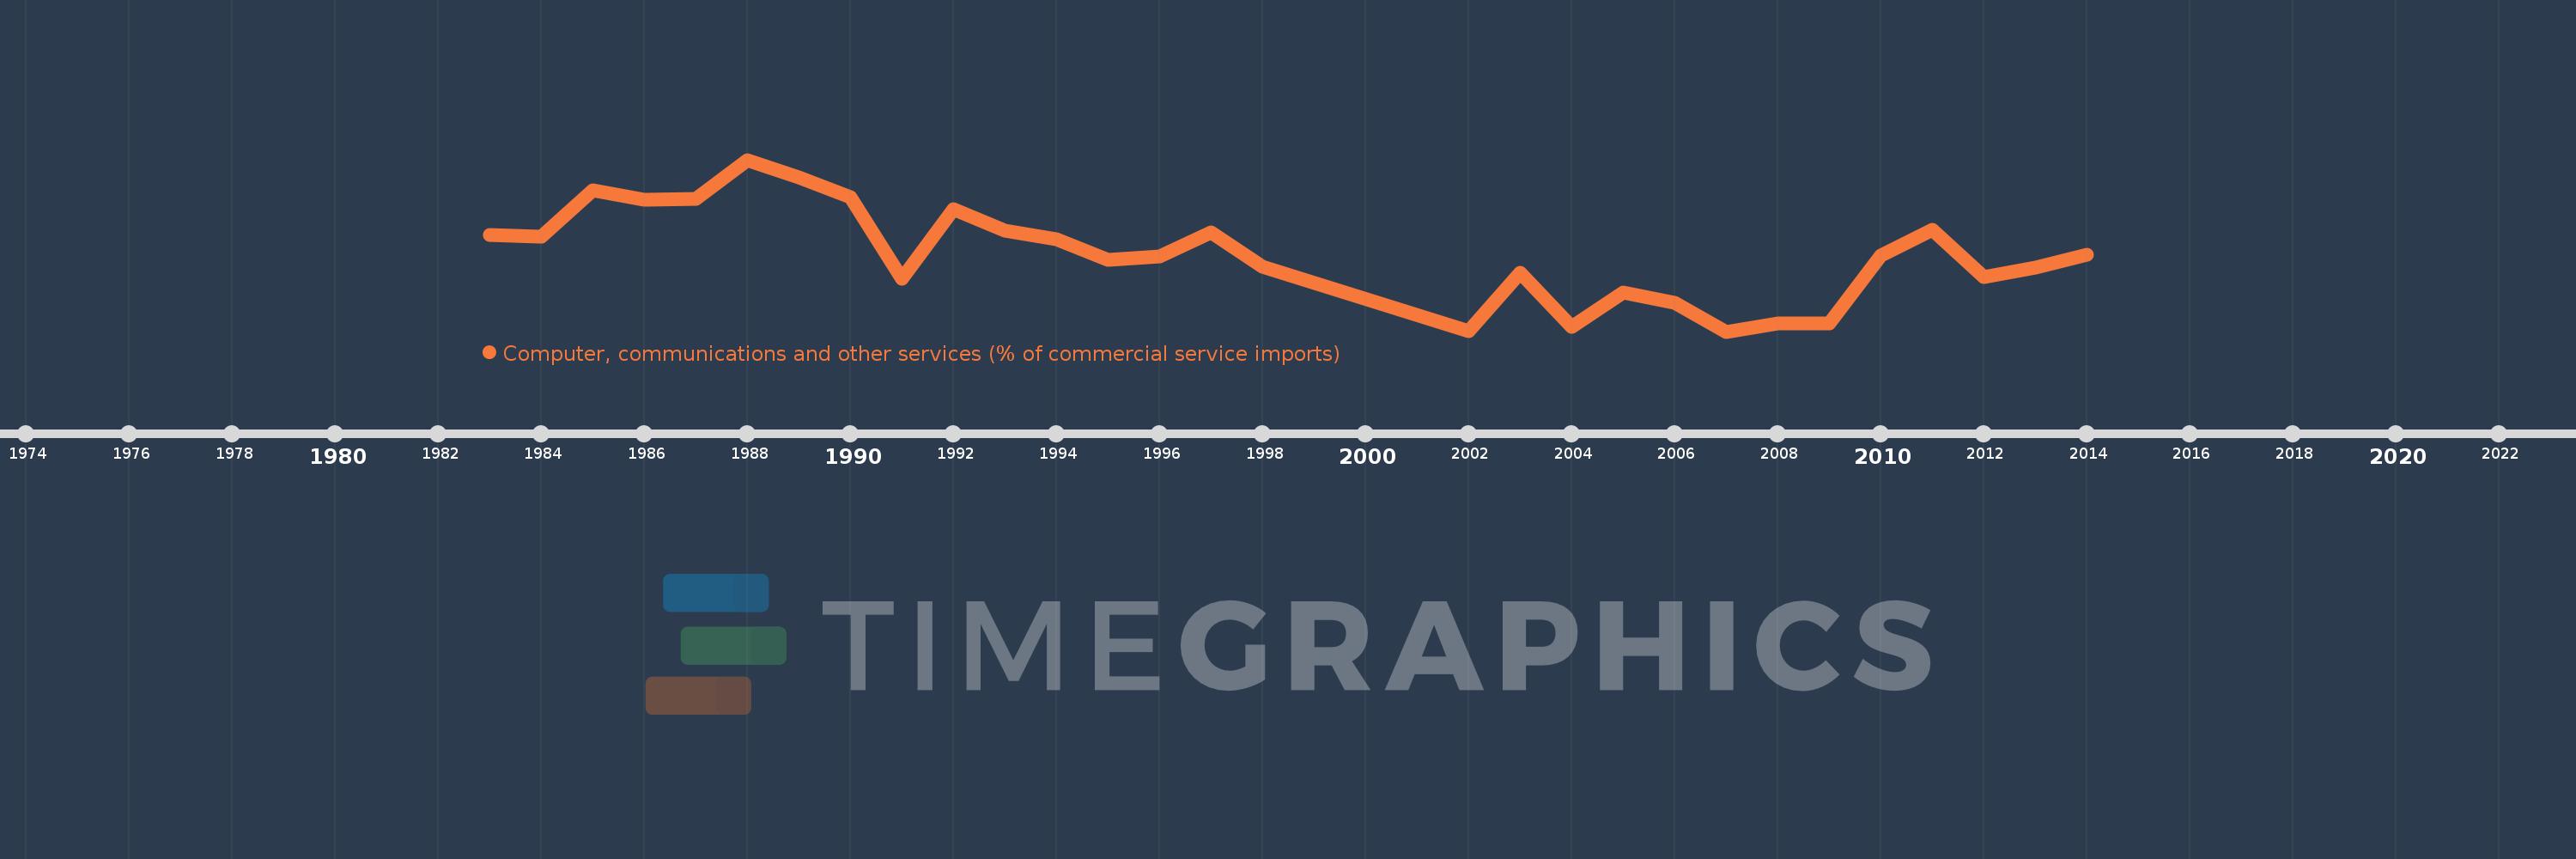
Computer, communications and other services (% of commercial service imports)
2014,2013,2012,2011,2010,2009,2008,2007,2006,2005,2004,2003,2002,1998,1997,1996,1995,1994,1993,1992,1991,1990,1989,1988,1987,1986,1985,1984,1983
This statistics in other country:
AfghanistanAlbaniaAlgeriaAngolaAntigua and BarbudaArab WorldArgentinaArmeniaArubaAustraliaAustriaAzerbaijanBahamas, TheBahrainBangladeshBarbadosBelarusBelgiumBelizeBeninBermudaBhutanBoliviaBosnia and HerzegovinaBotswanaBrazilBrunei DarussalamBulgariaBurkina FasoBurundiCabo VerdeCambodiaCameroonCanadaCaribbean small statesCentral African RepublicCentral Europe and the BalticsChadChileChinaColombiaComorosCongo, Dem. Rep.Congo, Rep.Costa RicaCote d'IvoireCroatiaCuracaoCyprusCzech RepublicDenmarkDjiboutiDominicaDominican RepublicEarly-demographic dividendEast Asia & PacificEast Asia & Pacific (excluding high income)East Asia & Pacific (IDA & IBRD countries)EcuadorEgypt, Arab Rep.El SalvadorEquatorial GuineaEritreaEstoniaEthiopiaEuro areaEurope & Central AsiaEurope & Central Asia (excluding high income)Europe & Central Asia (IDA & IBRD countries)European UnionFaroe IslandsFijiFinlandFragile and conflict affected situationsFranceFrench PolynesiaGabonGambia, TheGeorgiaGermanyGhanaGreeceGrenadaGuatemalaGuineaGuinea-BissauGuyanaHaitiHeavily indebted poor countries (HIPC)High incomeHondurasHong Kong SAR, ChinaHungaryIBRD onlyIcelandIDA & IBRD totalIDA onlyIDA totalIndiaIndonesiaIran, Islamic Rep.IraqIrelandIsraelItalyJamaicaJapanJordanKazakhstanKenyaKiribatiKorea, Rep.KosovoKuwaitKyrgyz RepublicLao PDRLate-demographic dividendLatin America & Caribbean Latin America & Caribbean (excluding high income)Latin America & the Caribbean (IDA & IBRD countries)LatviaLeast developed countries: UN classificationLebanonLesothoLiberiaLibyaLithuaniaLow & middle incomeLow incomeLower middle incomeLuxembourgMacao SAR, ChinaMacedonia, FYRMadagascarMalawiMalaysiaMaldivesMaliMaltaMarshall IslandsMauritaniaMauritiusMexicoMicronesia, Fed. Sts.Middle East & North AfricaMiddle East & North Africa (excluding high income)Middle East & North Africa (IDA & IBRD countries)Middle incomeMoldovaMongoliaMontenegroMoroccoMozambiqueMyanmarNamibiaNepalNetherlandsNew CaledoniaNew ZealandNicaraguaNigerNigeriaNorth AmericaNorwayOECD membersOmanOther small statesPacific island small statesPakistanPalauPanamaPapua New GuineaParaguayPeruPhilippinesPolandPortugalPost-demographic dividendPre-demographic dividendQatarRomaniaRussian FederationRwandaSamoaSao Tome and PrincipeSaudi ArabiaSenegalSerbiaSeychellesSierra LeoneSingaporeSint Maarten (Dutch part)Slovak RepublicSloveniaSmall statesSolomon IslandsSouth AfricaSouth AsiaSouth Asia (IDA & IBRD)South SudanSpainSri LankaSt. Kitts and NevisSt. LuciaSt. Vincent and the GrenadinesSub-Saharan Africa Sub-Saharan Africa (excluding high income)Sub-Saharan Africa (IDA & IBRD countries)SudanSurinameSwazilandSwedenSwitzerlandSyrian Arab RepublicTajikistanTanzaniaThailandTimor-LesteTogoTongaTrinidad and TobagoTunisiaTurkeyTuvaluUgandaUkraineUnited KingdomUnited StatesUpper middle incomeUruguayVanuatuVenezuela, RBWest Bank and GazaWorldYemen, Rep.ZambiaZimbabwe Timeline:
This timeline shows a graph from 1983 to 2014 of Guinea-Bissau. No data until 1982. Number of actual observations by date: 29.
Source name:
World Development Indicators
Source organization:
International Monetary Fund, Balance of Payments Statistics Yearbook and data files.
Categories, topics:
Private Sector, Trade
Last updated:
apr 23, 2017
Indicators value changes by year
Maximum:
63.464
jan 1, 1988
At the date of observation
Value
Absolute change
Change from previous value
jan 1, 1983
36.029
+36.029
0.0%
jan 1, 1984
35.606
-0.423
-1.18%
jan 1, 1985
52.358
+16.752
47.05%
jan 1, 1986
49.004
-3.355
-6.41%
jan 1, 1987
49.306
+0.302
0.62%
jan 1, 1988
63.464
+14.158
28.72%
jan 1, 1989
56.959
-6.505
-10.25%
jan 1, 1990
49.816
-7.143
-12.54%
jan 1, 1991
20.009
-29.807
-59.83%
jan 1, 1992
45.618
+25.608
127.98%
jan 1, 1993
37.571
-8.047
-17.64%
jan 1, 1994
34.609
-2.962
-7.88%
jan 1, 1995
26.998
-7.611
-21.99%
jan 1, 1996
28.143
+1.145
4.24%
jan 1, 1997
36.9
+8.757
31.12%
jan 1, 1998
24.641
-12.259
-33.22%
jan 1, 2002
0.978
-23.663
-96.03%
jan 1, 2003
22.376
+21.398
2.19K%
jan 1, 2004
2.548
-19.828
-88.61%
jan 1, 2005
15.095
+12.547
492.42%
jan 1, 2006
11.37
-3.725
-24.68%
jan 1, 2007
0.889
-10.481
-92.18%
jan 1, 2008
3.942
+3.053
343.36%
jan 1, 2009
3.956
+0.014
0.36%
jan 1, 2010
28.48
+24.524
619.86%
jan 1, 2011
38.04
+9.56
33.57%
jan 1, 2012
20.838
-17.202
-45.22%
jan 1, 2013
24.306
+3.468
16.64%
jan 1, 2014
28.818
+4.512
18.56%
Ranking of countries by current statistics by years


Comments: