29
/
en
AIzaSyAYiBZKx7MnpbEhh9jyipgxe19OcubqV5w
April 1, 2024
26371
Early-demographic dividend
EAR
false
2
1
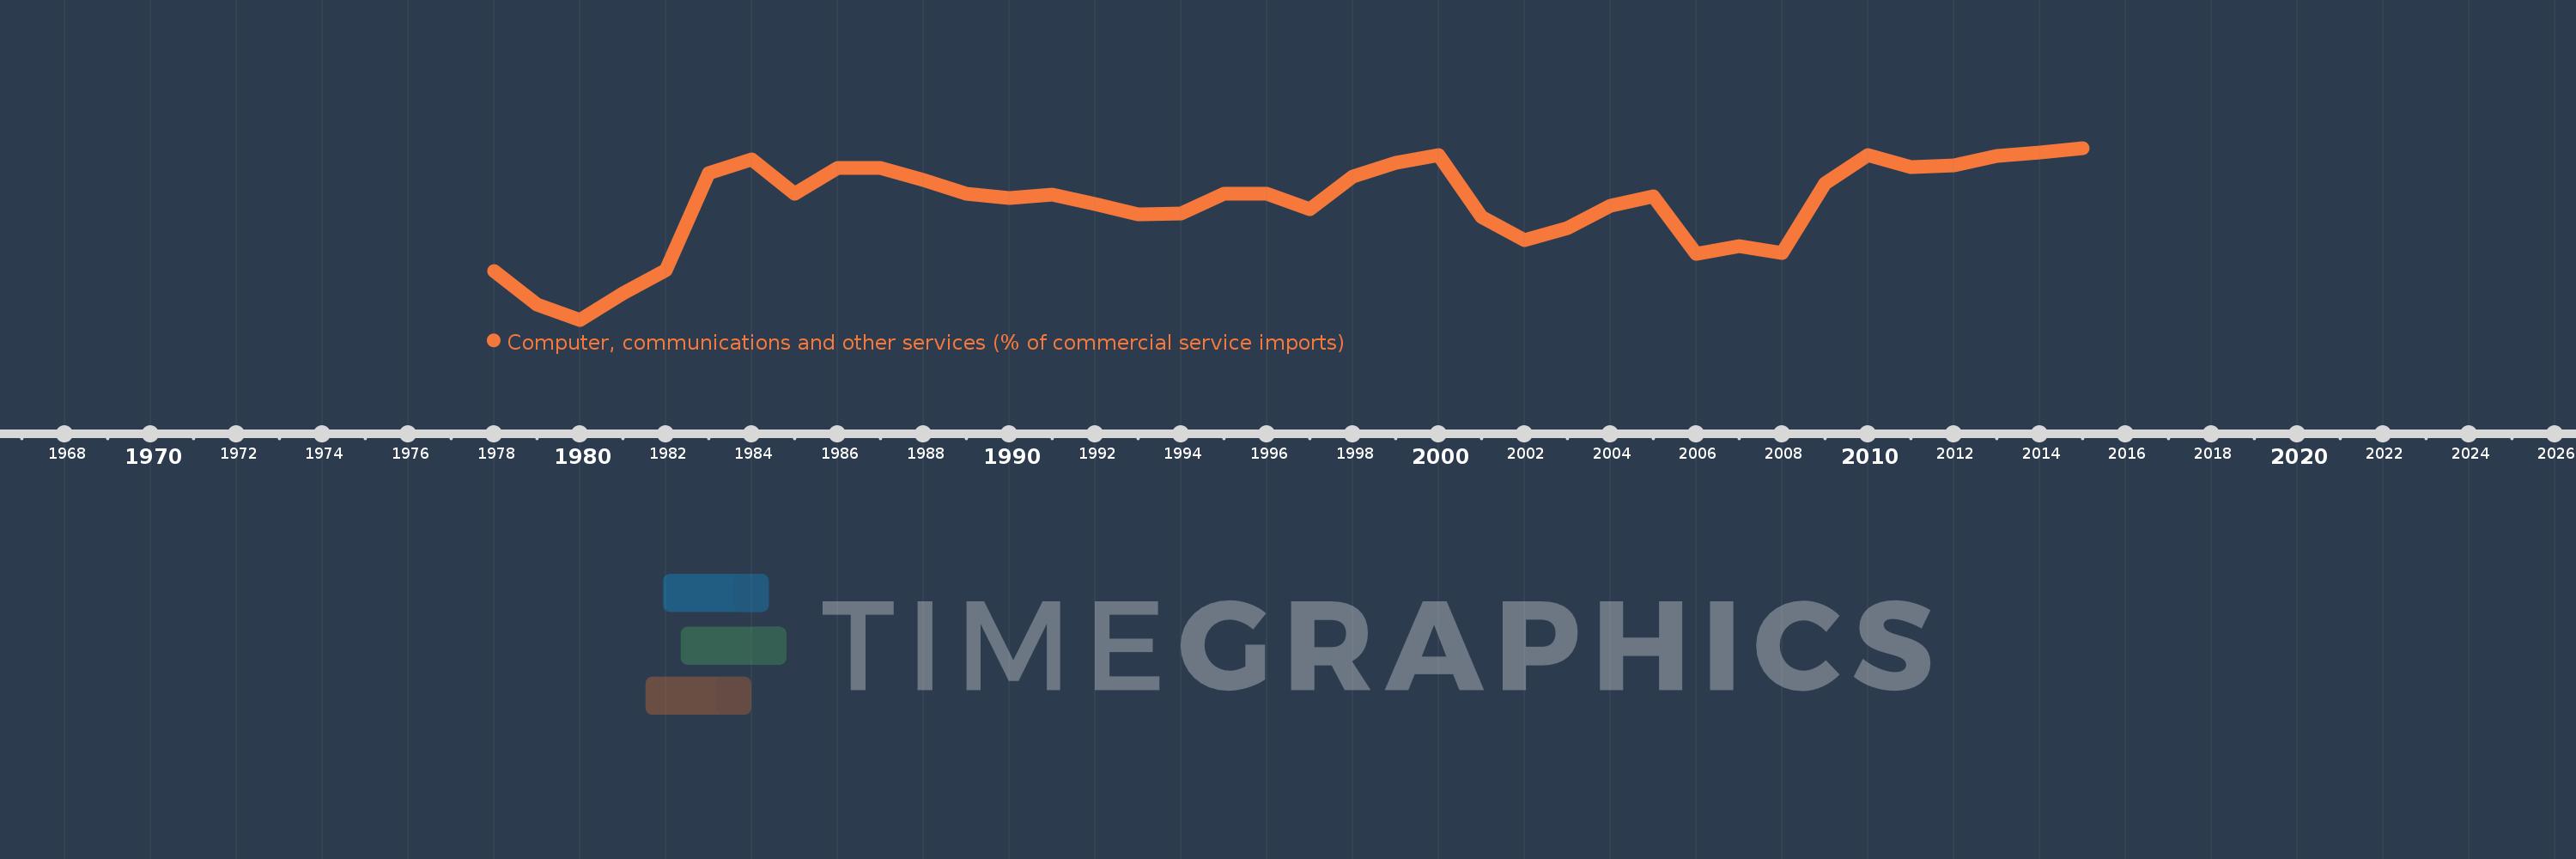
Computer, communications and other services (% of commercial service imports)
2015,2014,2013,2012,2011,2010,2009,2008,2007,2006,2005,2004,2003,2002,2001,2000,1999,1998,1997,1996,1995,1994,1993,1992,1991,1990,1989,1988,1987,1986,1985,1984,1983,1982,1981,1980,1979,1978
This statistics in other country:
AfghanistanAlbaniaAlgeriaAngolaAntigua and BarbudaArab WorldArgentinaArmeniaArubaAustraliaAustriaAzerbaijanBahamas, TheBahrainBangladeshBarbadosBelarusBelgiumBelizeBeninBermudaBhutanBoliviaBosnia and HerzegovinaBotswanaBrazilBrunei DarussalamBulgariaBurkina FasoBurundiCabo VerdeCambodiaCameroonCanadaCaribbean small statesCentral African RepublicCentral Europe and the BalticsChadChileChinaColombiaComorosCongo, Dem. Rep.Congo, Rep.Costa RicaCote d'IvoireCroatiaCuracaoCyprusCzech RepublicDenmarkDjiboutiDominicaDominican RepublicEarly-demographic dividendEast Asia & PacificEast Asia & Pacific (excluding high income)East Asia & Pacific (IDA & IBRD countries)EcuadorEgypt, Arab Rep.El SalvadorEquatorial GuineaEritreaEstoniaEthiopiaEuro areaEurope & Central AsiaEurope & Central Asia (excluding high income)Europe & Central Asia (IDA & IBRD countries)European UnionFaroe IslandsFijiFinlandFragile and conflict affected situationsFranceFrench PolynesiaGabonGambia, TheGeorgiaGermanyGhanaGreeceGrenadaGuatemalaGuineaGuinea-BissauGuyanaHaitiHeavily indebted poor countries (HIPC)High incomeHondurasHong Kong SAR, ChinaHungaryIBRD onlyIcelandIDA & IBRD totalIDA onlyIDA totalIndiaIndonesiaIran, Islamic Rep.IraqIrelandIsraelItalyJamaicaJapanJordanKazakhstanKenyaKiribatiKorea, Rep.KosovoKuwaitKyrgyz RepublicLao PDRLate-demographic dividendLatin America & Caribbean Latin America & Caribbean (excluding high income)Latin America & the Caribbean (IDA & IBRD countries)LatviaLeast developed countries: UN classificationLebanonLesothoLiberiaLibyaLithuaniaLow & middle incomeLow incomeLower middle incomeLuxembourgMacao SAR, ChinaMacedonia, FYRMadagascarMalawiMalaysiaMaldivesMaliMaltaMarshall IslandsMauritaniaMauritiusMexicoMicronesia, Fed. Sts.Middle East & North AfricaMiddle East & North Africa (excluding high income)Middle East & North Africa (IDA & IBRD countries)Middle incomeMoldovaMongoliaMontenegroMoroccoMozambiqueMyanmarNamibiaNepalNetherlandsNew CaledoniaNew ZealandNicaraguaNigerNigeriaNorth AmericaNorwayOECD membersOmanOther small statesPacific island small statesPakistanPalauPanamaPapua New GuineaParaguayPeruPhilippinesPolandPortugalPost-demographic dividendPre-demographic dividendQatarRomaniaRussian FederationRwandaSamoaSao Tome and PrincipeSaudi ArabiaSenegalSerbiaSeychellesSierra LeoneSingaporeSint Maarten (Dutch part)Slovak RepublicSloveniaSmall statesSolomon IslandsSouth AfricaSouth AsiaSouth Asia (IDA & IBRD)South SudanSpainSri LankaSt. Kitts and NevisSt. LuciaSt. Vincent and the GrenadinesSub-Saharan Africa Sub-Saharan Africa (excluding high income)Sub-Saharan Africa (IDA & IBRD countries)SudanSurinameSwazilandSwedenSwitzerlandSyrian Arab RepublicTajikistanTanzaniaThailandTimor-LesteTogoTongaTrinidad and TobagoTunisiaTurkeyTuvaluUgandaUkraineUnited KingdomUnited StatesUpper middle incomeUruguayVanuatuVenezuela, RBWest Bank and GazaWorldYemen, Rep.ZambiaZimbabwe Timeline:
This timeline shows a graph from 1978 to 2015 of Early-demographic dividend. No data until 1977. Number of actual observations by date: 38.
Source name:
World Development Indicators
Source organization:
International Monetary Fund, Balance of Payments Statistics Yearbook and data files.
Categories, topics:
Private Sector, Trade
Last updated:
apr 23, 2017
Indicators value changes by year
Minimum:
19.512
jan 1, 1980
Maximum:
33.169
jan 1, 2015
At the date of observation
Value
Absolute change
Change from previous value
jan 1, 1978
23.369
+23.369
0.0%
jan 1, 1979
20.725
-2.643
-11.31%
jan 1, 1980
19.512
-1.213
-5.85%
jan 1, 1981
21.616
+2.103
10.78%
jan 1, 1982
23.431
+1.815
8.4%
jan 1, 1983
31.157
+7.726
32.98%
jan 1, 1984
32.288
+1.131
3.63%
jan 1, 1985
29.502
-2.786
-8.63%
jan 1, 1986
31.557
+2.055
6.96%
jan 1, 1987
31.58
+0.024
0.07%
jan 1, 1988
30.608
-0.972
-3.08%
jan 1, 1989
29.526
-1.083
-3.54%
jan 1, 1990
29.192
-0.333
-1.13%
jan 1, 1991
29.466
+0.273
0.94%
jan 1, 1992
28.735
-0.73
-2.48%
jan 1, 1993
27.917
-0.818
-2.85%
jan 1, 1994
27.972
+0.054
0.19%
jan 1, 1995
29.535
+1.563
5.59%
jan 1, 1996
29.532
-0.003
-0.01%
jan 1, 1997
28.282
-1.249
-4.23%
jan 1, 1998
30.883
+2.601
9.2%
jan 1, 1999
31.991
+1.108
3.59%
jan 1, 2000
32.625
+0.633
1.98%
jan 1, 2001
27.669
-4.956
-15.19%
jan 1, 2002
25.815
-1.853
-6.7%
jan 1, 2003
26.764
+0.948
3.67%
jan 1, 2004
28.56
+1.797
6.71%
jan 1, 2005
29.337
+0.777
2.72%
jan 1, 2006
24.734
-4.603
-15.69%
jan 1, 2007
25.389
+0.655
2.65%
jan 1, 2008
24.84
-0.549
-2.16%
jan 1, 2009
30.327
+5.487
22.09%
jan 1, 2010
32.569
+2.243
7.4%
jan 1, 2011
31.628
-0.941
-2.89%
jan 1, 2012
31.791
+0.163
0.52%
jan 1, 2013
32.568
+0.777
2.44%
jan 1, 2014
32.835
+0.267
0.82%
jan 1, 2015
33.169
+0.334
1.02%
Ranking of countries by current statistics by years


Comments: