29
/
en
AIzaSyAYiBZKx7MnpbEhh9jyipgxe19OcubqV5w
April 1, 2024
279596
Vanuatu
VUT
true
2
1
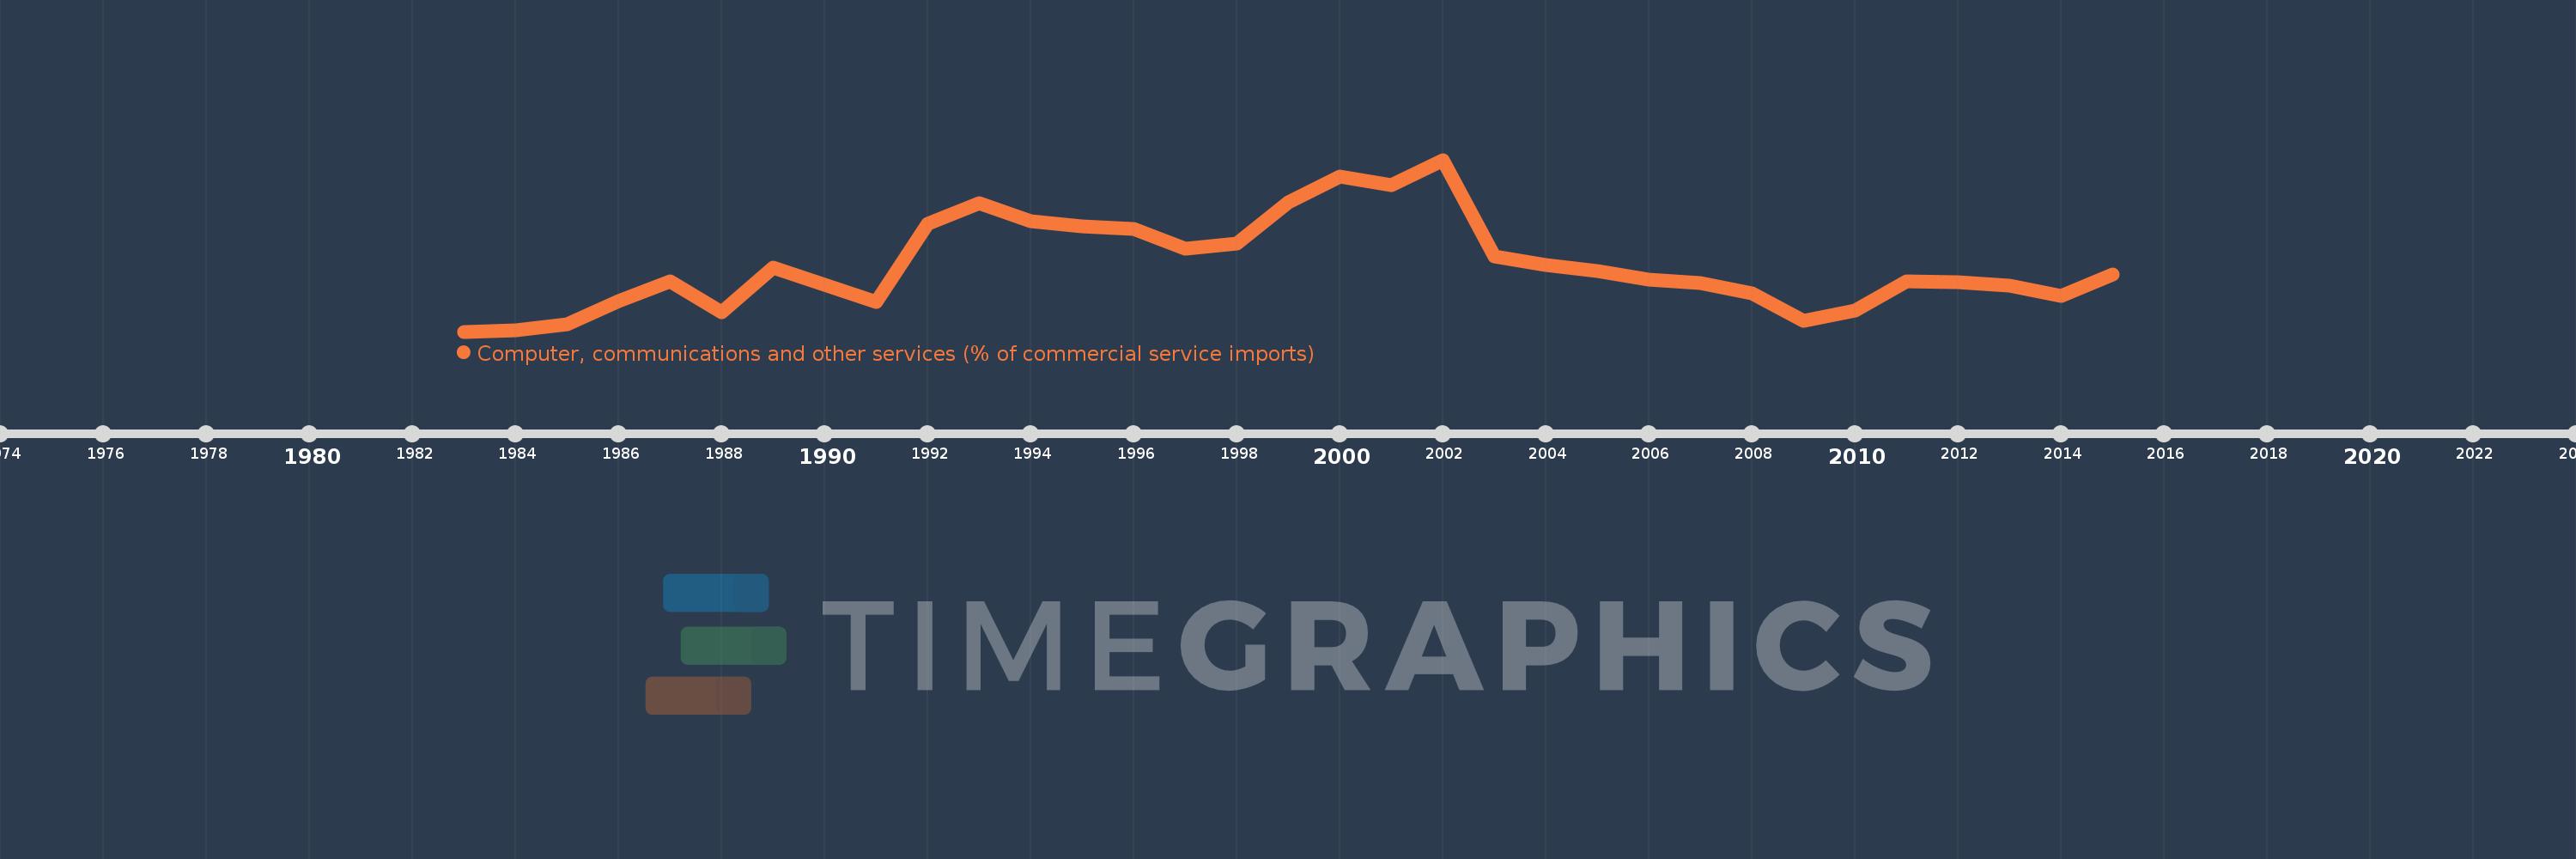
Computer, communications and other services (% of commercial service imports)
2015,2014,2013,2012,2011,2010,2009,2008,2007,2006,2005,2004,2003,2002,2001,2000,1999,1998,1997,1996,1995,1994,1993,1992,1991,1990,1989,1988,1987,1986,1985,1984,1983
This statistics in other country:
AfghanistanAlbaniaAlgeriaAngolaAntigua and BarbudaArab WorldArgentinaArmeniaArubaAustraliaAustriaAzerbaijanBahamas, TheBahrainBangladeshBarbadosBelarusBelgiumBelizeBeninBermudaBhutanBoliviaBosnia and HerzegovinaBotswanaBrazilBrunei DarussalamBulgariaBurkina FasoBurundiCabo VerdeCambodiaCameroonCanadaCaribbean small statesCentral African RepublicCentral Europe and the BalticsChadChileChinaColombiaComorosCongo, Dem. Rep.Congo, Rep.Costa RicaCote d'IvoireCroatiaCuracaoCyprusCzech RepublicDenmarkDjiboutiDominicaDominican RepublicEarly-demographic dividendEast Asia & PacificEast Asia & Pacific (excluding high income)East Asia & Pacific (IDA & IBRD countries)EcuadorEgypt, Arab Rep.El SalvadorEquatorial GuineaEritreaEstoniaEthiopiaEuro areaEurope & Central AsiaEurope & Central Asia (excluding high income)Europe & Central Asia (IDA & IBRD countries)European UnionFaroe IslandsFijiFinlandFragile and conflict affected situationsFranceFrench PolynesiaGabonGambia, TheGeorgiaGermanyGhanaGreeceGrenadaGuatemalaGuineaGuinea-BissauGuyanaHaitiHeavily indebted poor countries (HIPC)High incomeHondurasHong Kong SAR, ChinaHungaryIBRD onlyIcelandIDA & IBRD totalIDA onlyIDA totalIndiaIndonesiaIran, Islamic Rep.IraqIrelandIsraelItalyJamaicaJapanJordanKazakhstanKenyaKiribatiKorea, Rep.KosovoKuwaitKyrgyz RepublicLao PDRLate-demographic dividendLatin America & Caribbean Latin America & Caribbean (excluding high income)Latin America & the Caribbean (IDA & IBRD countries)LatviaLeast developed countries: UN classificationLebanonLesothoLiberiaLibyaLithuaniaLow & middle incomeLow incomeLower middle incomeLuxembourgMacao SAR, ChinaMacedonia, FYRMadagascarMalawiMalaysiaMaldivesMaliMaltaMarshall IslandsMauritaniaMauritiusMexicoMicronesia, Fed. Sts.Middle East & North AfricaMiddle East & North Africa (excluding high income)Middle East & North Africa (IDA & IBRD countries)Middle incomeMoldovaMongoliaMontenegroMoroccoMozambiqueMyanmarNamibiaNepalNetherlandsNew CaledoniaNew ZealandNicaraguaNigerNigeriaNorth AmericaNorwayOECD membersOmanOther small statesPacific island small statesPakistanPalauPanamaPapua New GuineaParaguayPeruPhilippinesPolandPortugalPost-demographic dividendPre-demographic dividendQatarRomaniaRussian FederationRwandaSamoaSao Tome and PrincipeSaudi ArabiaSenegalSerbiaSeychellesSierra LeoneSingaporeSint Maarten (Dutch part)Slovak RepublicSloveniaSmall statesSolomon IslandsSouth AfricaSouth AsiaSouth Asia (IDA & IBRD)South SudanSpainSri LankaSt. Kitts and NevisSt. LuciaSt. Vincent and the GrenadinesSub-Saharan Africa Sub-Saharan Africa (excluding high income)Sub-Saharan Africa (IDA & IBRD countries)SudanSurinameSwazilandSwedenSwitzerlandSyrian Arab RepublicTajikistanTanzaniaThailandTimor-LesteTogoTongaTrinidad and TobagoTunisiaTurkeyTuvaluUgandaUkraineUnited KingdomUnited StatesUpper middle incomeUruguayVanuatuVenezuela, RBWest Bank and GazaWorldYemen, Rep.ZambiaZimbabwe Timeline:
This timeline shows a graph from 1983 to 2015 of Vanuatu. No data until 1982. Number of actual observations by date: 33.
Source name:
World Development Indicators
Source organization:
International Monetary Fund, Balance of Payments Statistics Yearbook and data files.
Categories, topics:
Private Sector, Trade
Last updated:
apr 23, 2017
Indicators value changes by year
Maximum:
40.198
jan 1, 2002
At the date of observation
Value
Absolute change
Change from previous value
jan 1, 1983
4.931
+4.931
0.0%
jan 1, 1984
5.159
+0.228
4.62%
jan 1, 1985
6.355
+1.196
23.19%
jan 1, 1986
11.124
+4.769
75.03%
jan 1, 1987
15.288
+4.164
37.43%
jan 1, 1988
8.876
-6.412
-41.94%
jan 1, 1989
18.052
+9.177
103.39%
jan 1, 1990
14.506
-3.546
-19.64%
jan 1, 1991
11.088
-3.418
-23.56%
jan 1, 1992
26.988
+15.9
143.4%
jan 1, 1993
31.221
+4.233
15.68%
jan 1, 1994
27.562
-3.659
-11.72%
jan 1, 1995
26.455
-1.107
-4.02%
jan 1, 1996
26.015
-0.44
-1.66%
jan 1, 1997
21.923
-4.092
-15.73%
jan 1, 1998
22.963
+1.04
4.74%
jan 1, 1999
31.416
+8.454
36.81%
jan 1, 2000
36.829
+5.413
17.23%
jan 1, 2001
35.023
-1.806
-4.9%
jan 1, 2002
40.198
+5.175
14.78%
jan 1, 2003
20.314
-19.884
-49.47%
jan 1, 2004
18.633
-1.681
-8.27%
jan 1, 2005
17.275
-1.358
-7.29%
jan 1, 2006
15.607
-1.668
-9.65%
jan 1, 2007
14.899
-0.708
-4.54%
jan 1, 2008
12.849
-2.05
-13.76%
jan 1, 2009
7.153
-5.696
-44.33%
jan 1, 2010
9.164
+2.012
28.12%
jan 1, 2011
15.267
+6.102
66.59%
jan 1, 2012
15.118
-0.148
-0.97%
jan 1, 2013
14.348
-0.77
-5.09%
jan 1, 2014
12.246
-2.102
-14.65%
jan 1, 2015
16.639
+4.394
35.88%
Ranking of countries by current statistics by years


Comments: