29
/
en
AIzaSyAYiBZKx7MnpbEhh9jyipgxe19OcubqV5w
April 1, 2024
62462
World
WLD
false
2
1
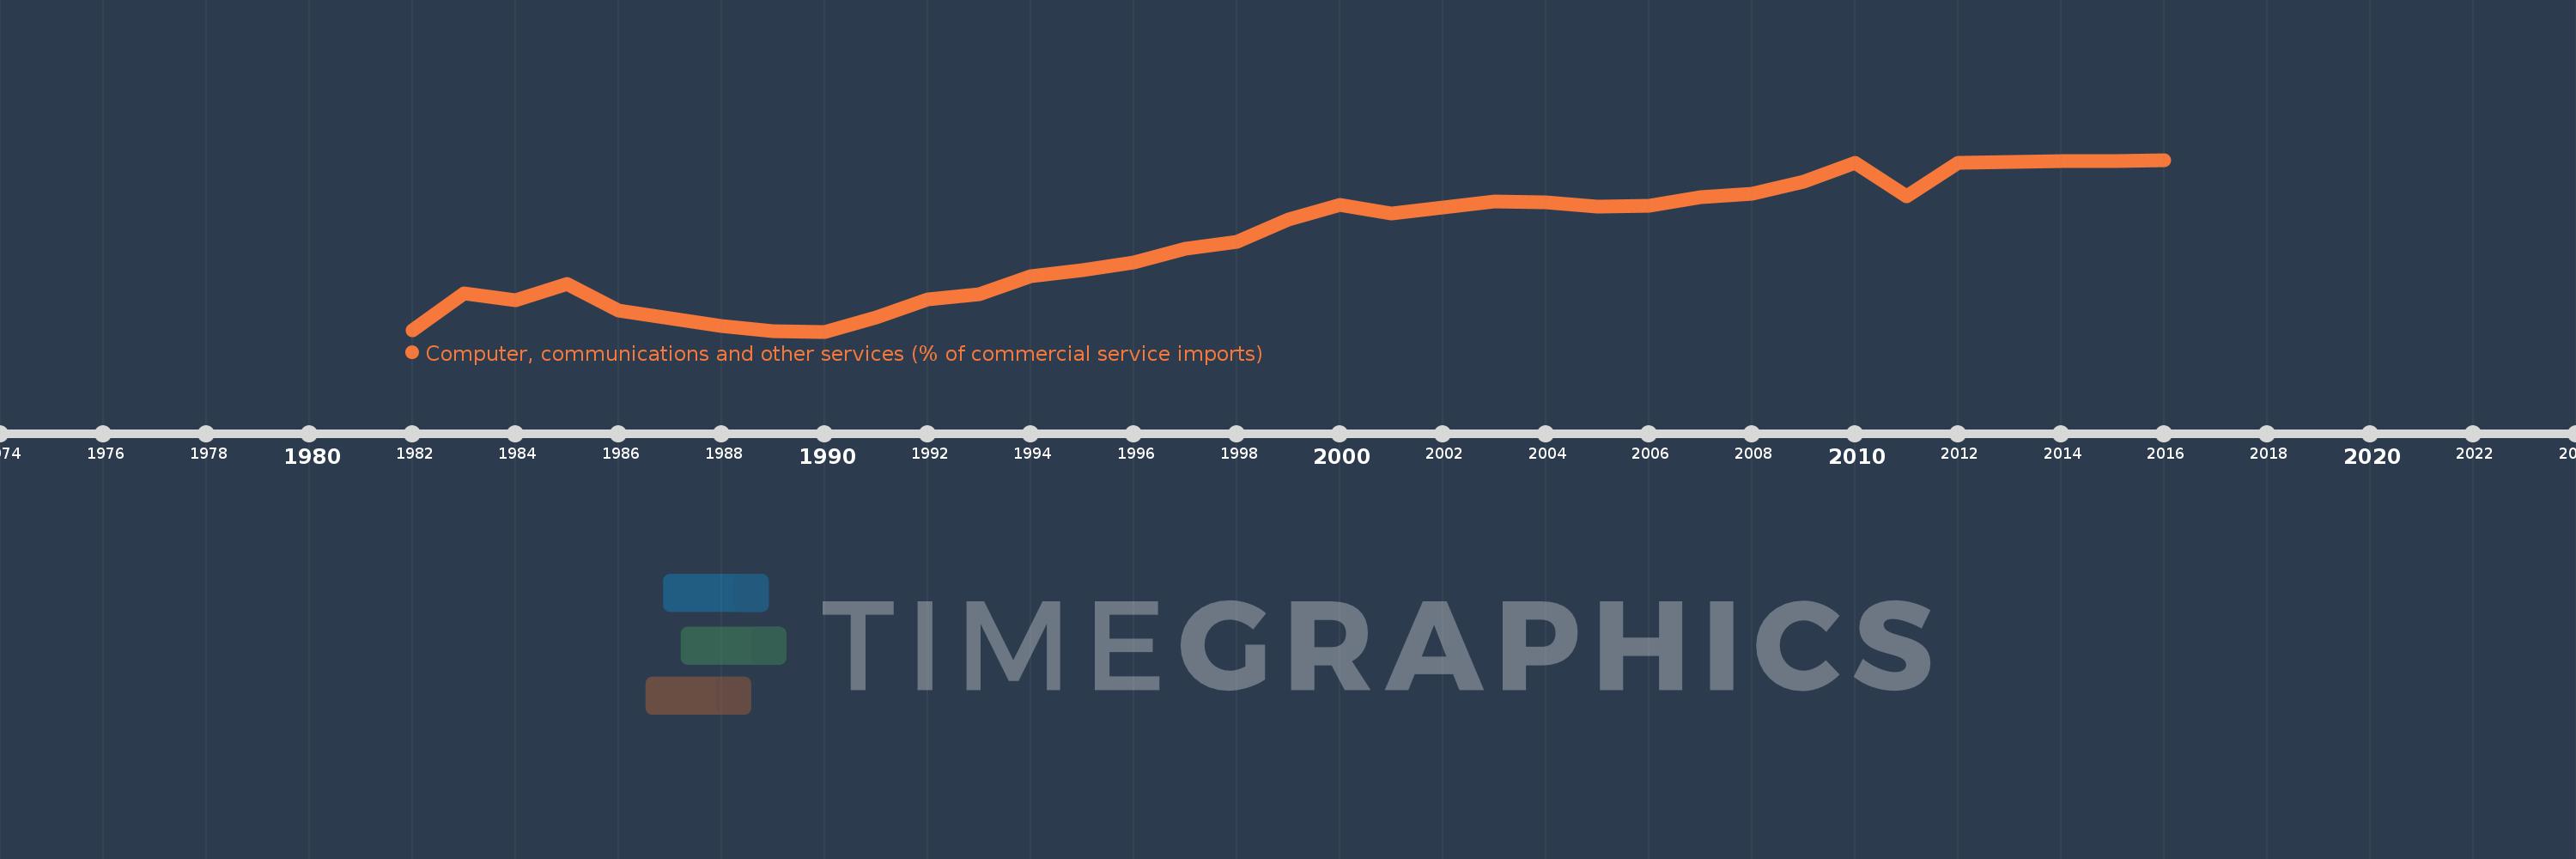
Computer, communications and other services (% of commercial service imports)
2016,2015,2014,2013,2012,2011,2010,2009,2008,2007,2006,2005,2004,2003,2002,2001,2000,1999,1998,1997,1996,1995,1994,1993,1992,1991,1990,1989,1988,1987,1986,1985,1984,1983,1982
This statistics in other country:
AfghanistanAlbaniaAlgeriaAngolaAntigua and BarbudaArab WorldArgentinaArmeniaArubaAustraliaAustriaAzerbaijanBahamas, TheBahrainBangladeshBarbadosBelarusBelgiumBelizeBeninBermudaBhutanBoliviaBosnia and HerzegovinaBotswanaBrazilBrunei DarussalamBulgariaBurkina FasoBurundiCabo VerdeCambodiaCameroonCanadaCaribbean small statesCentral African RepublicCentral Europe and the BalticsChadChileChinaColombiaComorosCongo, Dem. Rep.Congo, Rep.Costa RicaCote d'IvoireCroatiaCuracaoCyprusCzech RepublicDenmarkDjiboutiDominicaDominican RepublicEarly-demographic dividendEast Asia & PacificEast Asia & Pacific (excluding high income)East Asia & Pacific (IDA & IBRD countries)EcuadorEgypt, Arab Rep.El SalvadorEquatorial GuineaEritreaEstoniaEthiopiaEuro areaEurope & Central AsiaEurope & Central Asia (excluding high income)Europe & Central Asia (IDA & IBRD countries)European UnionFaroe IslandsFijiFinlandFragile and conflict affected situationsFranceFrench PolynesiaGabonGambia, TheGeorgiaGermanyGhanaGreeceGrenadaGuatemalaGuineaGuinea-BissauGuyanaHaitiHeavily indebted poor countries (HIPC)High incomeHondurasHong Kong SAR, ChinaHungaryIBRD onlyIcelandIDA & IBRD totalIDA onlyIDA totalIndiaIndonesiaIran, Islamic Rep.IraqIrelandIsraelItalyJamaicaJapanJordanKazakhstanKenyaKiribatiKorea, Rep.KosovoKuwaitKyrgyz RepublicLao PDRLate-demographic dividendLatin America & Caribbean Latin America & Caribbean (excluding high income)Latin America & the Caribbean (IDA & IBRD countries)LatviaLeast developed countries: UN classificationLebanonLesothoLiberiaLibyaLithuaniaLow & middle incomeLow incomeLower middle incomeLuxembourgMacao SAR, ChinaMacedonia, FYRMadagascarMalawiMalaysiaMaldivesMaliMaltaMarshall IslandsMauritaniaMauritiusMexicoMicronesia, Fed. Sts.Middle East & North AfricaMiddle East & North Africa (excluding high income)Middle East & North Africa (IDA & IBRD countries)Middle incomeMoldovaMongoliaMontenegroMoroccoMozambiqueMyanmarNamibiaNepalNetherlandsNew CaledoniaNew ZealandNicaraguaNigerNigeriaNorth AmericaNorwayOECD membersOmanOther small statesPacific island small statesPakistanPalauPanamaPapua New GuineaParaguayPeruPhilippinesPolandPortugalPost-demographic dividendPre-demographic dividendQatarRomaniaRussian FederationRwandaSamoaSao Tome and PrincipeSaudi ArabiaSenegalSerbiaSeychellesSierra LeoneSingaporeSint Maarten (Dutch part)Slovak RepublicSloveniaSmall statesSolomon IslandsSouth AfricaSouth AsiaSouth Asia (IDA & IBRD)South SudanSpainSri LankaSt. Kitts and NevisSt. LuciaSt. Vincent and the GrenadinesSub-Saharan Africa Sub-Saharan Africa (excluding high income)Sub-Saharan Africa (IDA & IBRD countries)SudanSurinameSwazilandSwedenSwitzerlandSyrian Arab RepublicTajikistanTanzaniaThailandTimor-LesteTogoTongaTrinidad and TobagoTunisiaTurkeyTuvaluUgandaUkraineUnited KingdomUnited StatesUpper middle incomeUruguayVanuatuVenezuela, RBWest Bank and GazaWorldYemen, Rep.ZambiaZimbabwe Timeline:
This timeline shows a graph from 1982 to 2016 of World. No data until 1981. Number of actual observations by date: 35.
Source name:
World Development Indicators
Source organization:
International Monetary Fund, Balance of Payments Statistics Yearbook and data files.
Categories, topics:
Private Sector, Trade
Last updated:
apr 23, 2017
Indicators value changes by year
Minimum:
24.558
jan 1, 1990
Maximum:
41.658
jan 1, 2016
At the date of observation
Value
Absolute change
Change from previous value
jan 1, 1982
24.727
+24.727
0.0%
jan 1, 1983
28.381
+3.653
14.77%
jan 1, 1984
27.661
-0.72
-2.54%
jan 1, 1985
29.291
+1.63
5.89%
jan 1, 1986
26.649
-2.642
-9.02%
jan 1, 1987
25.891
-0.758
-2.84%
jan 1, 1988
25.108
-0.784
-3.03%
jan 1, 1989
24.576
-0.532
-2.12%
jan 1, 1990
24.558
-0.018
-0.07%
jan 1, 1991
25.94
+1.382
5.63%
jan 1, 1992
27.744
+1.804
6.95%
jan 1, 1993
28.275
+0.531
1.92%
jan 1, 1994
30.097
+1.822
6.44%
jan 1, 1995
30.659
+0.561
1.86%
jan 1, 1996
31.478
+0.82
2.67%
jan 1, 1997
32.846
+1.368
4.34%
jan 1, 1998
33.468
+0.622
1.89%
jan 1, 1999
35.756
+2.289
6.84%
jan 1, 2000
37.168
+1.411
3.95%
jan 1, 2001
36.273
-0.895
-2.41%
jan 1, 2002
36.911
+0.638
1.76%
jan 1, 2003
37.481
+0.571
1.55%
jan 1, 2004
37.464
-0.017
-0.05%
jan 1, 2005
36.997
-0.468
-1.25%
jan 1, 2006
37.064
+0.067
0.18%
jan 1, 2007
37.958
+0.894
2.41%
jan 1, 2008
38.306
+0.348
0.92%
jan 1, 2009
39.517
+1.211
3.16%
jan 1, 2010
41.368
+1.851
4.68%
jan 1, 2011
38.056
-3.312
-8.01%
jan 1, 2012
41.364
+3.308
8.69%
jan 1, 2013
41.444
+0.08
0.19%
jan 1, 2014
41.488
+0.044
0.11%
jan 1, 2015
41.56
+0.072
0.17%
jan 1, 2016
41.658
+0.098
0.24%
Ranking of countries by current statistics by years


Comments: