29
/
en
AIzaSyAYiBZKx7MnpbEhh9jyipgxe19OcubqV5w
April 1, 2024
224661
Poland
POL
true
2
1
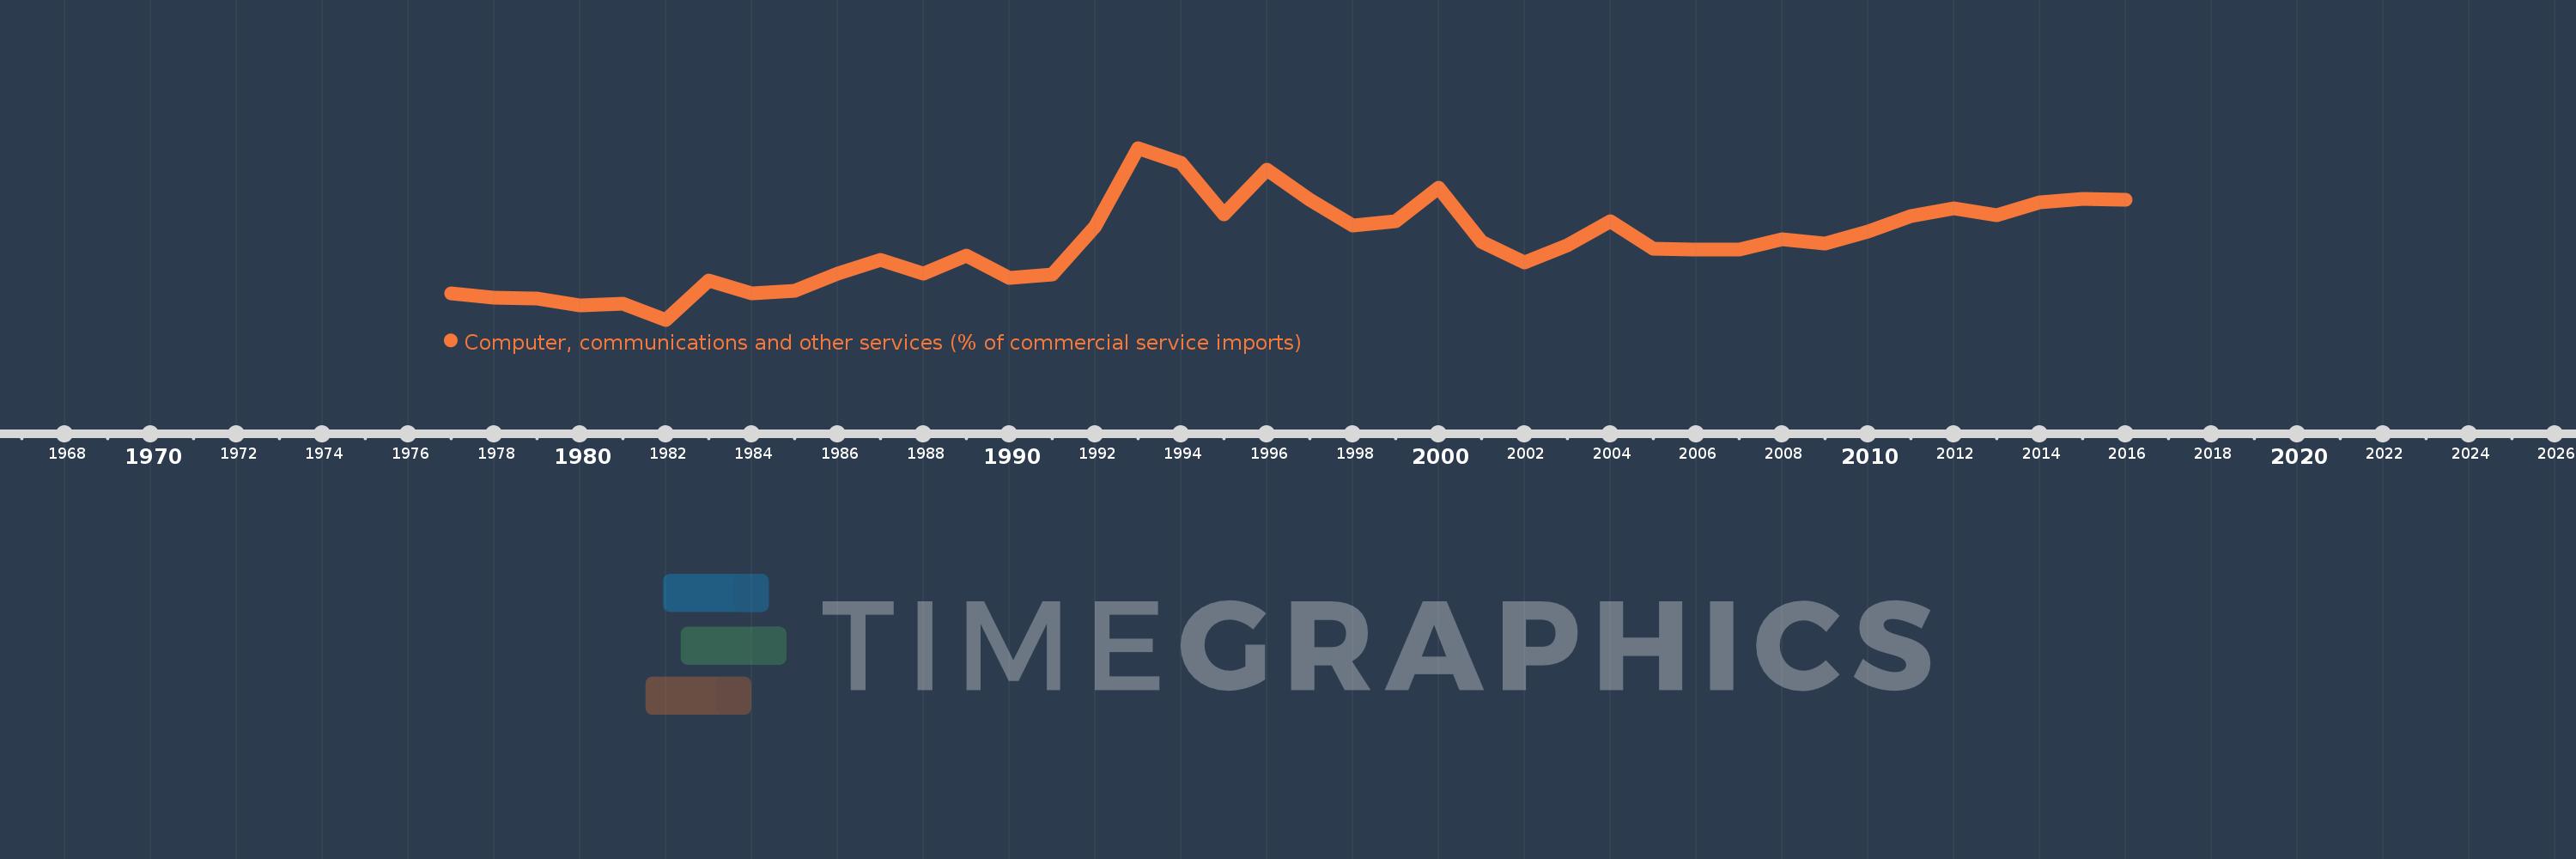
Computer, communications and other services (% of commercial service imports)
2016,2015,2014,2013,2012,2011,2010,2009,2008,2007,2006,2005,2004,2003,2002,2001,2000,1999,1998,1997,1996,1995,1994,1993,1992,1991,1990,1989,1988,1987,1986,1985,1984,1983,1982,1981,1980,1979,1978,1977
This statistics in other country:
AfghanistanAlbaniaAlgeriaAngolaAntigua and BarbudaArab WorldArgentinaArmeniaArubaAustraliaAustriaAzerbaijanBahamas, TheBahrainBangladeshBarbadosBelarusBelgiumBelizeBeninBermudaBhutanBoliviaBosnia and HerzegovinaBotswanaBrazilBrunei DarussalamBulgariaBurkina FasoBurundiCabo VerdeCambodiaCameroonCanadaCaribbean small statesCentral African RepublicCentral Europe and the BalticsChadChileChinaColombiaComorosCongo, Dem. Rep.Congo, Rep.Costa RicaCote d'IvoireCroatiaCuracaoCyprusCzech RepublicDenmarkDjiboutiDominicaDominican RepublicEarly-demographic dividendEast Asia & PacificEast Asia & Pacific (excluding high income)East Asia & Pacific (IDA & IBRD countries)EcuadorEgypt, Arab Rep.El SalvadorEquatorial GuineaEritreaEstoniaEthiopiaEuro areaEurope & Central AsiaEurope & Central Asia (excluding high income)Europe & Central Asia (IDA & IBRD countries)European UnionFaroe IslandsFijiFinlandFragile and conflict affected situationsFranceFrench PolynesiaGabonGambia, TheGeorgiaGermanyGhanaGreeceGrenadaGuatemalaGuineaGuinea-BissauGuyanaHaitiHeavily indebted poor countries (HIPC)High incomeHondurasHong Kong SAR, ChinaHungaryIBRD onlyIcelandIDA & IBRD totalIDA onlyIDA totalIndiaIndonesiaIran, Islamic Rep.IraqIrelandIsraelItalyJamaicaJapanJordanKazakhstanKenyaKiribatiKorea, Rep.KosovoKuwaitKyrgyz RepublicLao PDRLate-demographic dividendLatin America & Caribbean Latin America & Caribbean (excluding high income)Latin America & the Caribbean (IDA & IBRD countries)LatviaLeast developed countries: UN classificationLebanonLesothoLiberiaLibyaLithuaniaLow & middle incomeLow incomeLower middle incomeLuxembourgMacao SAR, ChinaMacedonia, FYRMadagascarMalawiMalaysiaMaldivesMaliMaltaMarshall IslandsMauritaniaMauritiusMexicoMicronesia, Fed. Sts.Middle East & North AfricaMiddle East & North Africa (excluding high income)Middle East & North Africa (IDA & IBRD countries)Middle incomeMoldovaMongoliaMontenegroMoroccoMozambiqueMyanmarNamibiaNepalNetherlandsNew CaledoniaNew ZealandNicaraguaNigerNigeriaNorth AmericaNorwayOECD membersOmanOther small statesPacific island small statesPakistanPalauPanamaPapua New GuineaParaguayPeruPhilippinesPolandPortugalPost-demographic dividendPre-demographic dividendQatarRomaniaRussian FederationRwandaSamoaSao Tome and PrincipeSaudi ArabiaSenegalSerbiaSeychellesSierra LeoneSingaporeSint Maarten (Dutch part)Slovak RepublicSloveniaSmall statesSolomon IslandsSouth AfricaSouth AsiaSouth Asia (IDA & IBRD)South SudanSpainSri LankaSt. Kitts and NevisSt. LuciaSt. Vincent and the GrenadinesSub-Saharan Africa Sub-Saharan Africa (excluding high income)Sub-Saharan Africa (IDA & IBRD countries)SudanSurinameSwazilandSwedenSwitzerlandSyrian Arab RepublicTajikistanTanzaniaThailandTimor-LesteTogoTongaTrinidad and TobagoTunisiaTurkeyTuvaluUgandaUkraineUnited KingdomUnited StatesUpper middle incomeUruguayVanuatuVenezuela, RBWest Bank and GazaWorldYemen, Rep.ZambiaZimbabwe Timeline:
This timeline shows a graph from 1977 to 2016 of Poland. No data until 1976. Number of actual observations by date: 40.
Source name:
World Development Indicators
Source organization:
International Monetary Fund, Balance of Payments Statistics Yearbook and data files.
Categories, topics:
Private Sector, Trade
Last updated:
apr 23, 2017
Indicators value changes by year
Minimum:
21.772
jan 1, 1982
Maximum:
60.099
jan 1, 1993
At the date of observation
Value
Absolute change
Change from previous value
jan 1, 1977
27.622
+27.622
0.0%
jan 1, 1978
26.738
-0.884
-3.2%
jan 1, 1979
26.43
-0.308
-1.15%
jan 1, 1980
24.906
-1.524
-5.77%
jan 1, 1981
25.26
+0.353
1.42%
jan 1, 1982
21.772
-3.488
-13.81%
jan 1, 1983
30.539
+8.767
40.27%
jan 1, 1984
27.594
-2.945
-9.64%
jan 1, 1985
28.225
+0.631
2.29%
jan 1, 1986
32.015
+3.791
13.43%
jan 1, 1987
35.189
+3.174
9.91%
jan 1, 1988
32.101
-3.088
-8.78%
jan 1, 1989
36.148
+4.047
12.61%
jan 1, 1990
31.084
-5.064
-14.01%
jan 1, 1991
31.788
+0.704
2.26%
jan 1, 1992
42.652
+10.864
34.18%
jan 1, 1993
60.099
+17.447
40.91%
jan 1, 1994
56.871
-3.228
-5.37%
jan 1, 1995
45.328
-11.543
-20.3%
jan 1, 1996
55.294
+9.966
21.99%
jan 1, 1997
48.619
-6.675
-12.07%
jan 1, 1998
42.834
-5.785
-11.9%
jan 1, 1999
43.726
+0.892
2.08%
jan 1, 2000
51.236
+7.51
17.18%
jan 1, 2001
39.219
-12.017
-23.45%
jan 1, 2002
34.538
-4.681
-11.94%
jan 1, 2003
38.298
+3.76
10.89%
jan 1, 2004
43.765
+5.467
14.28%
jan 1, 2005
37.66
-6.105
-13.95%
jan 1, 2006
37.477
-0.182
-0.48%
jan 1, 2007
37.373
-0.105
-0.28%
jan 1, 2008
39.691
+2.318
6.2%
jan 1, 2009
38.749
-0.942
-2.37%
jan 1, 2010
41.501
+2.753
7.1%
jan 1, 2011
44.821
+3.319
8.0%
jan 1, 2012
46.631
+1.811
4.04%
jan 1, 2013
45.129
-1.502
-3.22%
jan 1, 2014
47.975
+2.846
6.31%
jan 1, 2015
48.647
+0.671
1.4%
jan 1, 2016
48.538
-0.109
-0.22%
Ranking of countries by current statistics by years


Comments: