29
/
en
AIzaSyAYiBZKx7MnpbEhh9jyipgxe19OcubqV5w
April 1, 2024
169733
Korea, Rep.
KOR
true
2
1
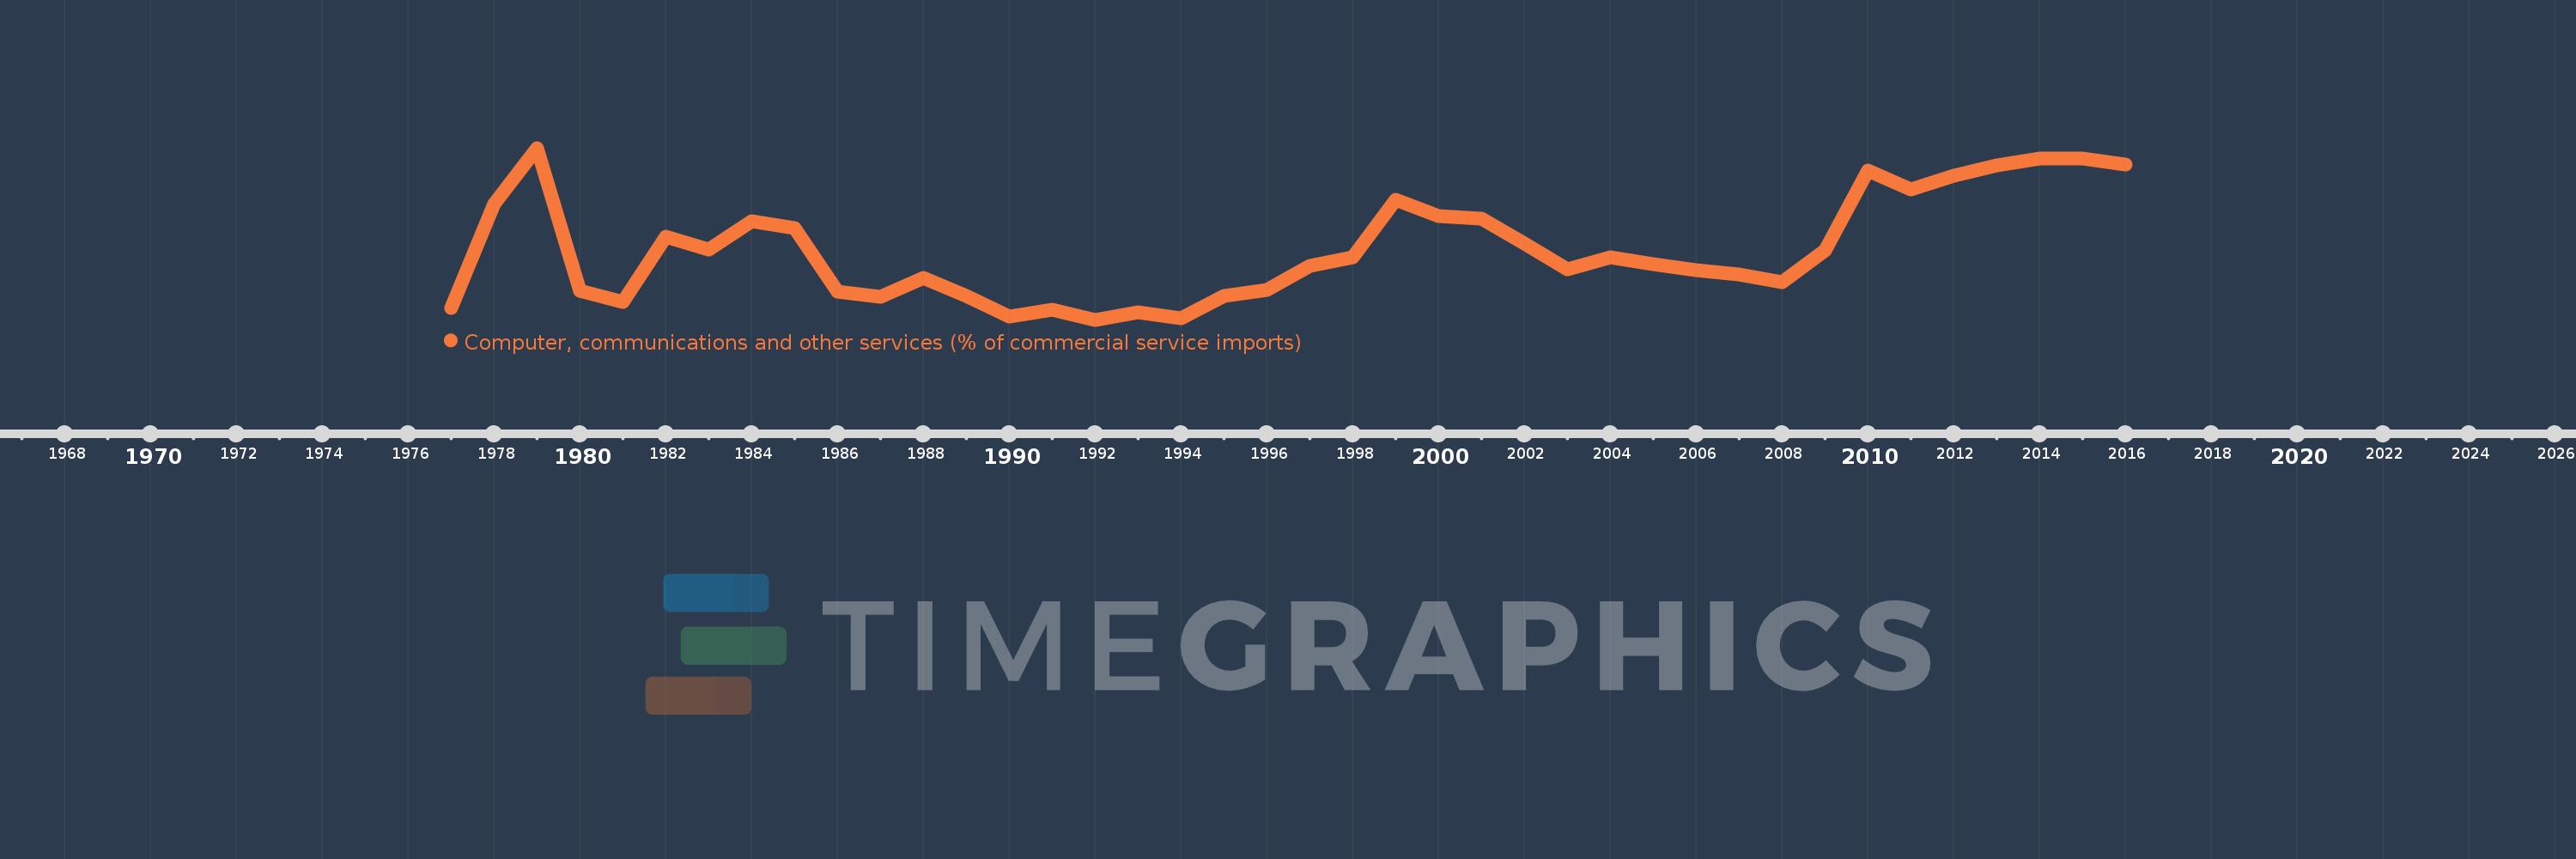
Computer, communications and other services (% of commercial service imports)
2016,2015,2014,2013,2012,2011,2010,2009,2008,2007,2006,2005,2004,2003,2002,2001,2000,1999,1998,1997,1996,1995,1994,1993,1992,1991,1990,1989,1988,1987,1986,1985,1984,1983,1982,1981,1980,1979,1978,1977
This statistics in other country:
AfghanistanAlbaniaAlgeriaAngolaAntigua and BarbudaArab WorldArgentinaArmeniaArubaAustraliaAustriaAzerbaijanBahamas, TheBahrainBangladeshBarbadosBelarusBelgiumBelizeBeninBermudaBhutanBoliviaBosnia and HerzegovinaBotswanaBrazilBrunei DarussalamBulgariaBurkina FasoBurundiCabo VerdeCambodiaCameroonCanadaCaribbean small statesCentral African RepublicCentral Europe and the BalticsChadChileChinaColombiaComorosCongo, Dem. Rep.Congo, Rep.Costa RicaCote d'IvoireCroatiaCuracaoCyprusCzech RepublicDenmarkDjiboutiDominicaDominican RepublicEarly-demographic dividendEast Asia & PacificEast Asia & Pacific (excluding high income)East Asia & Pacific (IDA & IBRD countries)EcuadorEgypt, Arab Rep.El SalvadorEquatorial GuineaEritreaEstoniaEthiopiaEuro areaEurope & Central AsiaEurope & Central Asia (excluding high income)Europe & Central Asia (IDA & IBRD countries)European UnionFaroe IslandsFijiFinlandFragile and conflict affected situationsFranceFrench PolynesiaGabonGambia, TheGeorgiaGermanyGhanaGreeceGrenadaGuatemalaGuineaGuinea-BissauGuyanaHaitiHeavily indebted poor countries (HIPC)High incomeHondurasHong Kong SAR, ChinaHungaryIBRD onlyIcelandIDA & IBRD totalIDA onlyIDA totalIndiaIndonesiaIran, Islamic Rep.IraqIrelandIsraelItalyJamaicaJapanJordanKazakhstanKenyaKiribatiKorea, Rep.KosovoKuwaitKyrgyz RepublicLao PDRLate-demographic dividendLatin America & Caribbean Latin America & Caribbean (excluding high income)Latin America & the Caribbean (IDA & IBRD countries)LatviaLeast developed countries: UN classificationLebanonLesothoLiberiaLibyaLithuaniaLow & middle incomeLow incomeLower middle incomeLuxembourgMacao SAR, ChinaMacedonia, FYRMadagascarMalawiMalaysiaMaldivesMaliMaltaMarshall IslandsMauritaniaMauritiusMexicoMicronesia, Fed. Sts.Middle East & North AfricaMiddle East & North Africa (excluding high income)Middle East & North Africa (IDA & IBRD countries)Middle incomeMoldovaMongoliaMontenegroMoroccoMozambiqueMyanmarNamibiaNepalNetherlandsNew CaledoniaNew ZealandNicaraguaNigerNigeriaNorth AmericaNorwayOECD membersOmanOther small statesPacific island small statesPakistanPalauPanamaPapua New GuineaParaguayPeruPhilippinesPolandPortugalPost-demographic dividendPre-demographic dividendQatarRomaniaRussian FederationRwandaSamoaSao Tome and PrincipeSaudi ArabiaSenegalSerbiaSeychellesSierra LeoneSingaporeSint Maarten (Dutch part)Slovak RepublicSloveniaSmall statesSolomon IslandsSouth AfricaSouth AsiaSouth Asia (IDA & IBRD)South SudanSpainSri LankaSt. Kitts and NevisSt. LuciaSt. Vincent and the GrenadinesSub-Saharan Africa Sub-Saharan Africa (excluding high income)Sub-Saharan Africa (IDA & IBRD countries)SudanSurinameSwazilandSwedenSwitzerlandSyrian Arab RepublicTajikistanTanzaniaThailandTimor-LesteTogoTongaTrinidad and TobagoTunisiaTurkeyTuvaluUgandaUkraineUnited KingdomUnited StatesUpper middle incomeUruguayVanuatuVenezuela, RBWest Bank and GazaWorldYemen, Rep.ZambiaZimbabwe Timeline:
This timeline shows a graph from 1977 to 2016 of Korea, Rep.. No data until 1976. Number of actual observations by date: 40.
Source name:
World Development Indicators
Source organization:
International Monetary Fund, Balance of Payments Statistics Yearbook and data files.
Categories, topics:
Private Sector, Trade
Last updated:
apr 23, 2017
Indicators value changes by year
Minimum:
31.472
jan 1, 1992
Maximum:
50.789
jan 1, 1979
At the date of observation
Value
Absolute change
Change from previous value
jan 1, 1977
32.772
+32.772
0.0%
jan 1, 1978
44.467
+11.695
35.69%
jan 1, 1979
50.789
+6.322
14.22%
jan 1, 1980
34.693
-16.096
-31.69%
jan 1, 1981
33.513
-1.179
-3.4%
jan 1, 1982
40.836
+7.322
21.85%
jan 1, 1983
39.383
-1.453
-3.56%
jan 1, 1984
42.545
+3.162
8.03%
jan 1, 1985
41.789
-0.756
-1.78%
jan 1, 1986
34.629
-7.16
-17.13%
jan 1, 1987
34.011
-0.618
-1.78%
jan 1, 1988
36.183
+2.171
6.38%
jan 1, 1989
34.191
-1.992
-5.5%
jan 1, 1990
31.816
-2.375
-6.95%
jan 1, 1991
32.645
+0.829
2.6%
jan 1, 1992
31.472
-1.174
-3.6%
jan 1, 1993
32.304
+0.832
2.64%
jan 1, 1994
31.665
-0.639
-1.98%
jan 1, 1995
34.1
+2.436
7.69%
jan 1, 1996
34.791
+0.691
2.03%
jan 1, 1997
37.512
+2.721
7.82%
jan 1, 1998
38.525
+1.013
2.7%
jan 1, 1999
44.953
+6.428
16.68%
jan 1, 2000
43.084
-1.87
-4.16%
jan 1, 2001
42.88
-0.203
-0.47%
jan 1, 2002
40.055
-2.825
-6.59%
jan 1, 2003
37.12
-2.936
-7.33%
jan 1, 2004
38.535
+1.416
3.81%
jan 1, 2005
37.765
-0.771
-2.0%
jan 1, 2006
37.039
-0.726
-1.92%
jan 1, 2007
36.542
-0.496
-1.34%
jan 1, 2008
35.73
-0.812
-2.22%
jan 1, 2009
39.233
+3.503
9.81%
jan 1, 2010
48.285
+9.051
23.07%
jan 1, 2011
46.09
-2.195
-4.55%
jan 1, 2012
47.623
+1.533
3.33%
jan 1, 2013
48.786
+1.163
2.44%
jan 1, 2014
49.586
+0.8
1.64%
jan 1, 2015
49.602
+0.016
0.03%
jan 1, 2016
48.915
-0.687
-1.39%
Ranking of countries by current statistics by years


Comments: