29
/
en
AIzaSyAYiBZKx7MnpbEhh9jyipgxe19OcubqV5w
April 1, 2024
76951
Bahrain
BHR
true
2
1
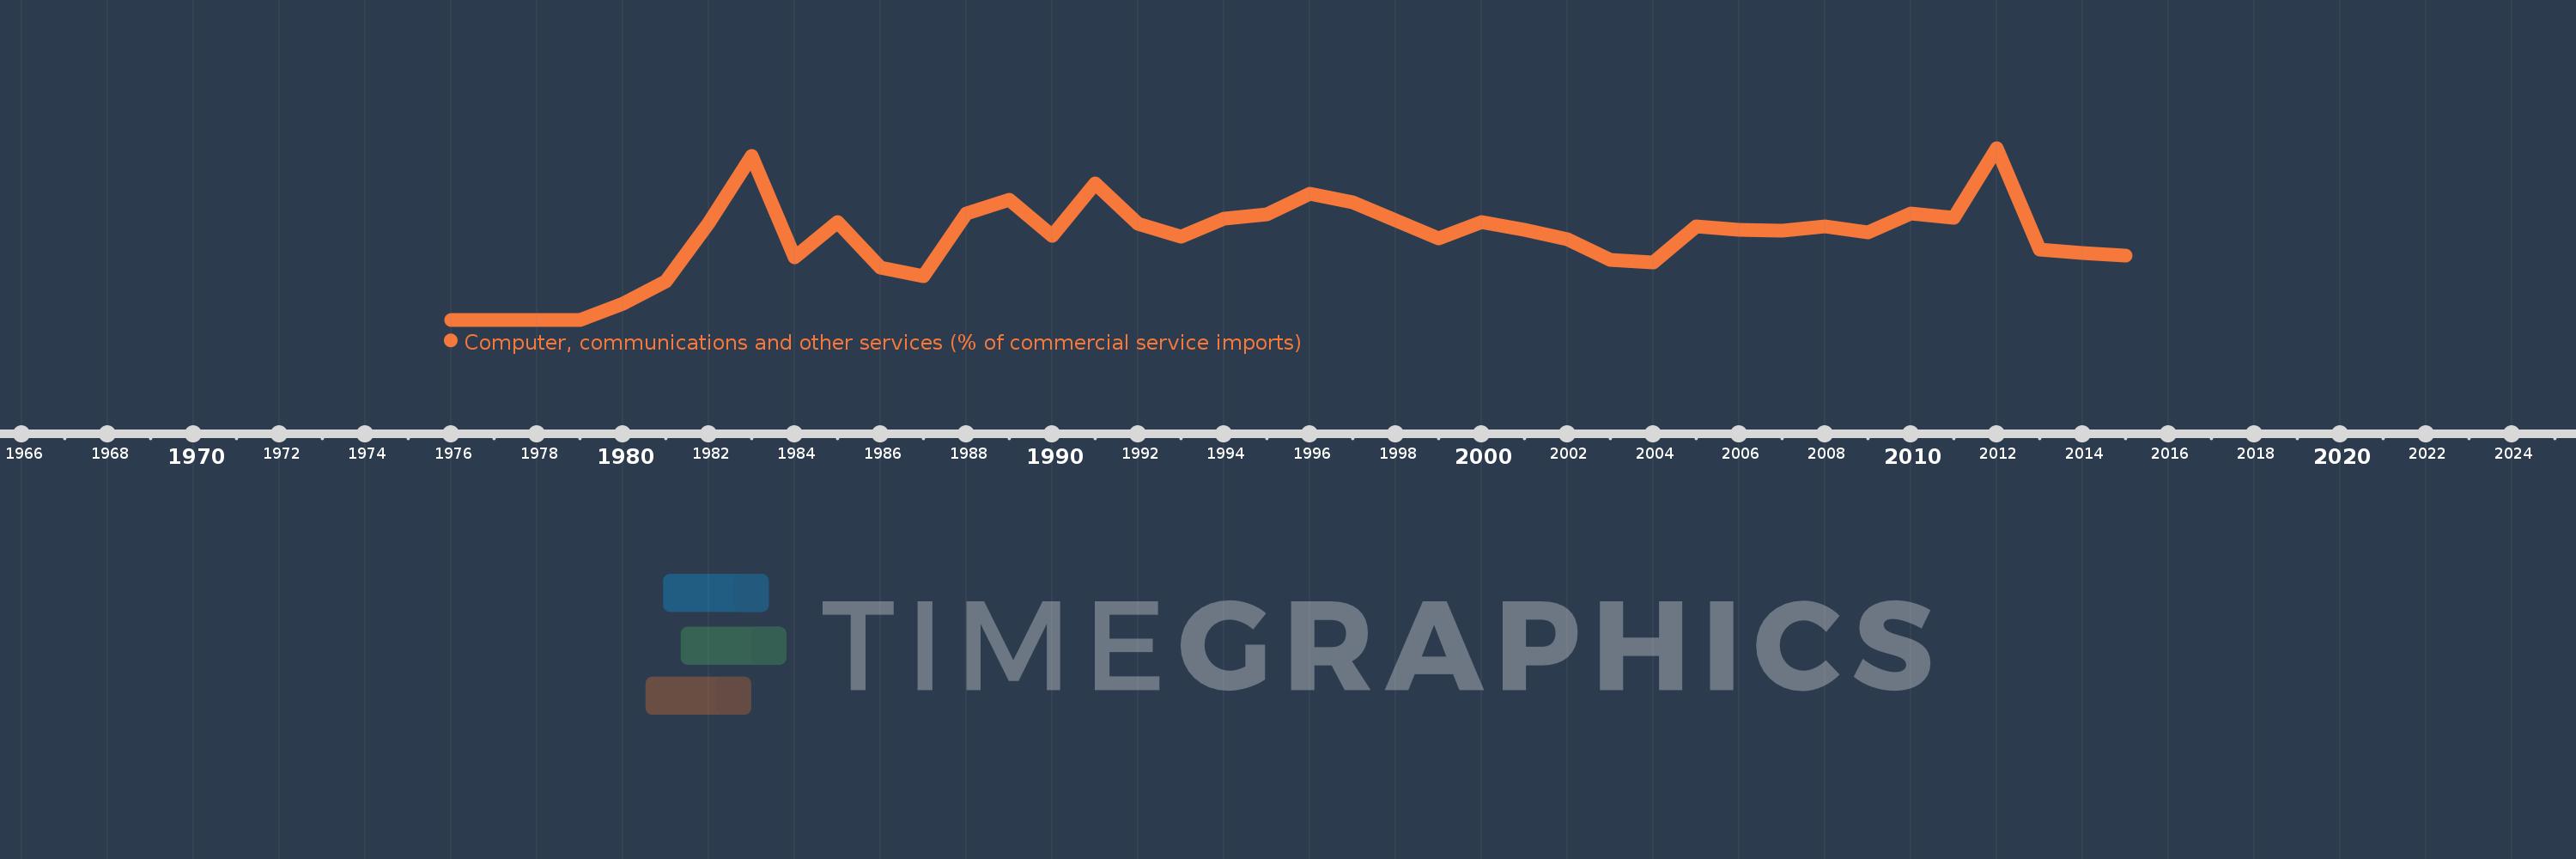
Computer, communications and other services (% of commercial service imports)
2015,2014,2013,2012,2011,2010,2009,2008,2007,2006,2005,2004,2003,2002,2001,2000,1999,1998,1997,1996,1995,1994,1993,1992,1991,1990,1989,1988,1987,1986,1985,1984,1983,1982,1981,1980,1979,1978,1977,1976
This statistics in other country:
AfghanistanAlbaniaAlgeriaAngolaAntigua and BarbudaArab WorldArgentinaArmeniaArubaAustraliaAustriaAzerbaijanBahamas, TheBahrainBangladeshBarbadosBelarusBelgiumBelizeBeninBermudaBhutanBoliviaBosnia and HerzegovinaBotswanaBrazilBrunei DarussalamBulgariaBurkina FasoBurundiCabo VerdeCambodiaCameroonCanadaCaribbean small statesCentral African RepublicCentral Europe and the BalticsChadChileChinaColombiaComorosCongo, Dem. Rep.Congo, Rep.Costa RicaCote d'IvoireCroatiaCuracaoCyprusCzech RepublicDenmarkDjiboutiDominicaDominican RepublicEarly-demographic dividendEast Asia & PacificEast Asia & Pacific (excluding high income)East Asia & Pacific (IDA & IBRD countries)EcuadorEgypt, Arab Rep.El SalvadorEquatorial GuineaEritreaEstoniaEthiopiaEuro areaEurope & Central AsiaEurope & Central Asia (excluding high income)Europe & Central Asia (IDA & IBRD countries)European UnionFaroe IslandsFijiFinlandFragile and conflict affected situationsFranceFrench PolynesiaGabonGambia, TheGeorgiaGermanyGhanaGreeceGrenadaGuatemalaGuineaGuinea-BissauGuyanaHaitiHeavily indebted poor countries (HIPC)High incomeHondurasHong Kong SAR, ChinaHungaryIBRD onlyIcelandIDA & IBRD totalIDA onlyIDA totalIndiaIndonesiaIran, Islamic Rep.IraqIrelandIsraelItalyJamaicaJapanJordanKazakhstanKenyaKiribatiKorea, Rep.KosovoKuwaitKyrgyz RepublicLao PDRLate-demographic dividendLatin America & Caribbean Latin America & Caribbean (excluding high income)Latin America & the Caribbean (IDA & IBRD countries)LatviaLeast developed countries: UN classificationLebanonLesothoLiberiaLibyaLithuaniaLow & middle incomeLow incomeLower middle incomeLuxembourgMacao SAR, ChinaMacedonia, FYRMadagascarMalawiMalaysiaMaldivesMaliMaltaMarshall IslandsMauritaniaMauritiusMexicoMicronesia, Fed. Sts.Middle East & North AfricaMiddle East & North Africa (excluding high income)Middle East & North Africa (IDA & IBRD countries)Middle incomeMoldovaMongoliaMontenegroMoroccoMozambiqueMyanmarNamibiaNepalNetherlandsNew CaledoniaNew ZealandNicaraguaNigerNigeriaNorth AmericaNorwayOECD membersOmanOther small statesPacific island small statesPakistanPalauPanamaPapua New GuineaParaguayPeruPhilippinesPolandPortugalPost-demographic dividendPre-demographic dividendQatarRomaniaRussian FederationRwandaSamoaSao Tome and PrincipeSaudi ArabiaSenegalSerbiaSeychellesSierra LeoneSingaporeSint Maarten (Dutch part)Slovak RepublicSloveniaSmall statesSolomon IslandsSouth AfricaSouth AsiaSouth Asia (IDA & IBRD)South SudanSpainSri LankaSt. Kitts and NevisSt. LuciaSt. Vincent and the GrenadinesSub-Saharan Africa Sub-Saharan Africa (excluding high income)Sub-Saharan Africa (IDA & IBRD countries)SudanSurinameSwazilandSwedenSwitzerlandSyrian Arab RepublicTajikistanTanzaniaThailandTimor-LesteTogoTongaTrinidad and TobagoTunisiaTurkeyTuvaluUgandaUkraineUnited KingdomUnited StatesUpper middle incomeUruguayVanuatuVenezuela, RBWest Bank and GazaWorldYemen, Rep.ZambiaZimbabwe Timeline:
This timeline shows a graph from 1976 to 2015 of Bahrain. No data until 1975. Number of actual observations by date: 40.
Source name:
World Development Indicators
Source organization:
International Monetary Fund, Balance of Payments Statistics Yearbook and data files.
Categories, topics:
Private Sector, Trade
Last updated:
apr 23, 2017
Indicators value changes by year
Maximum:
18.618
jan 1, 2012
At the date of observation
Value
Absolute change
Change from previous value
jan 1, 1977
0.0
+0.0
-40.0%
jan 1, 1978
0.0
+0.0
-211.11%
jan 1, 1979
0.0
0.0
-10.0%
jan 1, 1980
1.779
+1.779
1391.03 trl%
jan 1, 1981
4.197
+2.418
135.93%
jan 1, 1982
10.482
+6.285
149.74%
jan 1, 1983
17.725
+7.242
69.09%
jan 1, 1984
6.771
-10.953
-61.8%
jan 1, 1985
10.55
+3.778
55.8%
jan 1, 1986
5.65
-4.9
-46.44%
jan 1, 1987
4.69
-0.96
-16.99%
jan 1, 1988
11.495
+6.805
145.1%
jan 1, 1989
13.008
+1.513
13.16%
jan 1, 1990
9.082
-3.926
-30.18%
jan 1, 1991
14.798
+5.716
62.94%
jan 1, 1992
10.353
-4.445
-30.04%
jan 1, 1993
8.983
-1.371
-13.24%
jan 1, 1994
10.923
+1.94
21.6%
jan 1, 1995
11.463
+0.54
4.94%
jan 1, 1996
13.633
+2.17
18.93%
jan 1, 1997
12.76
-0.872
-6.4%
jan 1, 1998
10.809
-1.952
-15.3%
jan 1, 1999
8.813
-1.996
-18.47%
jan 1, 2000
10.547
+1.734
19.68%
jan 1, 2001
9.735
-0.812
-7.7%
jan 1, 2002
8.683
-1.052
-10.8%
jan 1, 2003
6.505
-2.178
-25.08%
jan 1, 2004
6.189
-0.316
-4.86%
jan 1, 2005
10.156
+3.967
64.09%
jan 1, 2006
9.746
-0.41
-4.03%
jan 1, 2007
9.659
-0.087
-0.9%
jan 1, 2008
10.101
+0.442
4.57%
jan 1, 2009
9.485
-0.616
-6.1%
jan 1, 2010
11.534
+2.049
21.6%
jan 1, 2011
11.029
-0.505
-4.38%
jan 1, 2012
18.618
+7.589
68.81%
jan 1, 2013
7.637
-10.981
-58.98%
jan 1, 2014
7.244
-0.393
-5.15%
jan 1, 2015
6.984
-0.26
-3.58%
Ranking of countries by current statistics by years


Comments: