29
/
en
AIzaSyAYiBZKx7MnpbEhh9jyipgxe19OcubqV5w
April 1, 2024
90821
Brazil
BRA
true
2
1
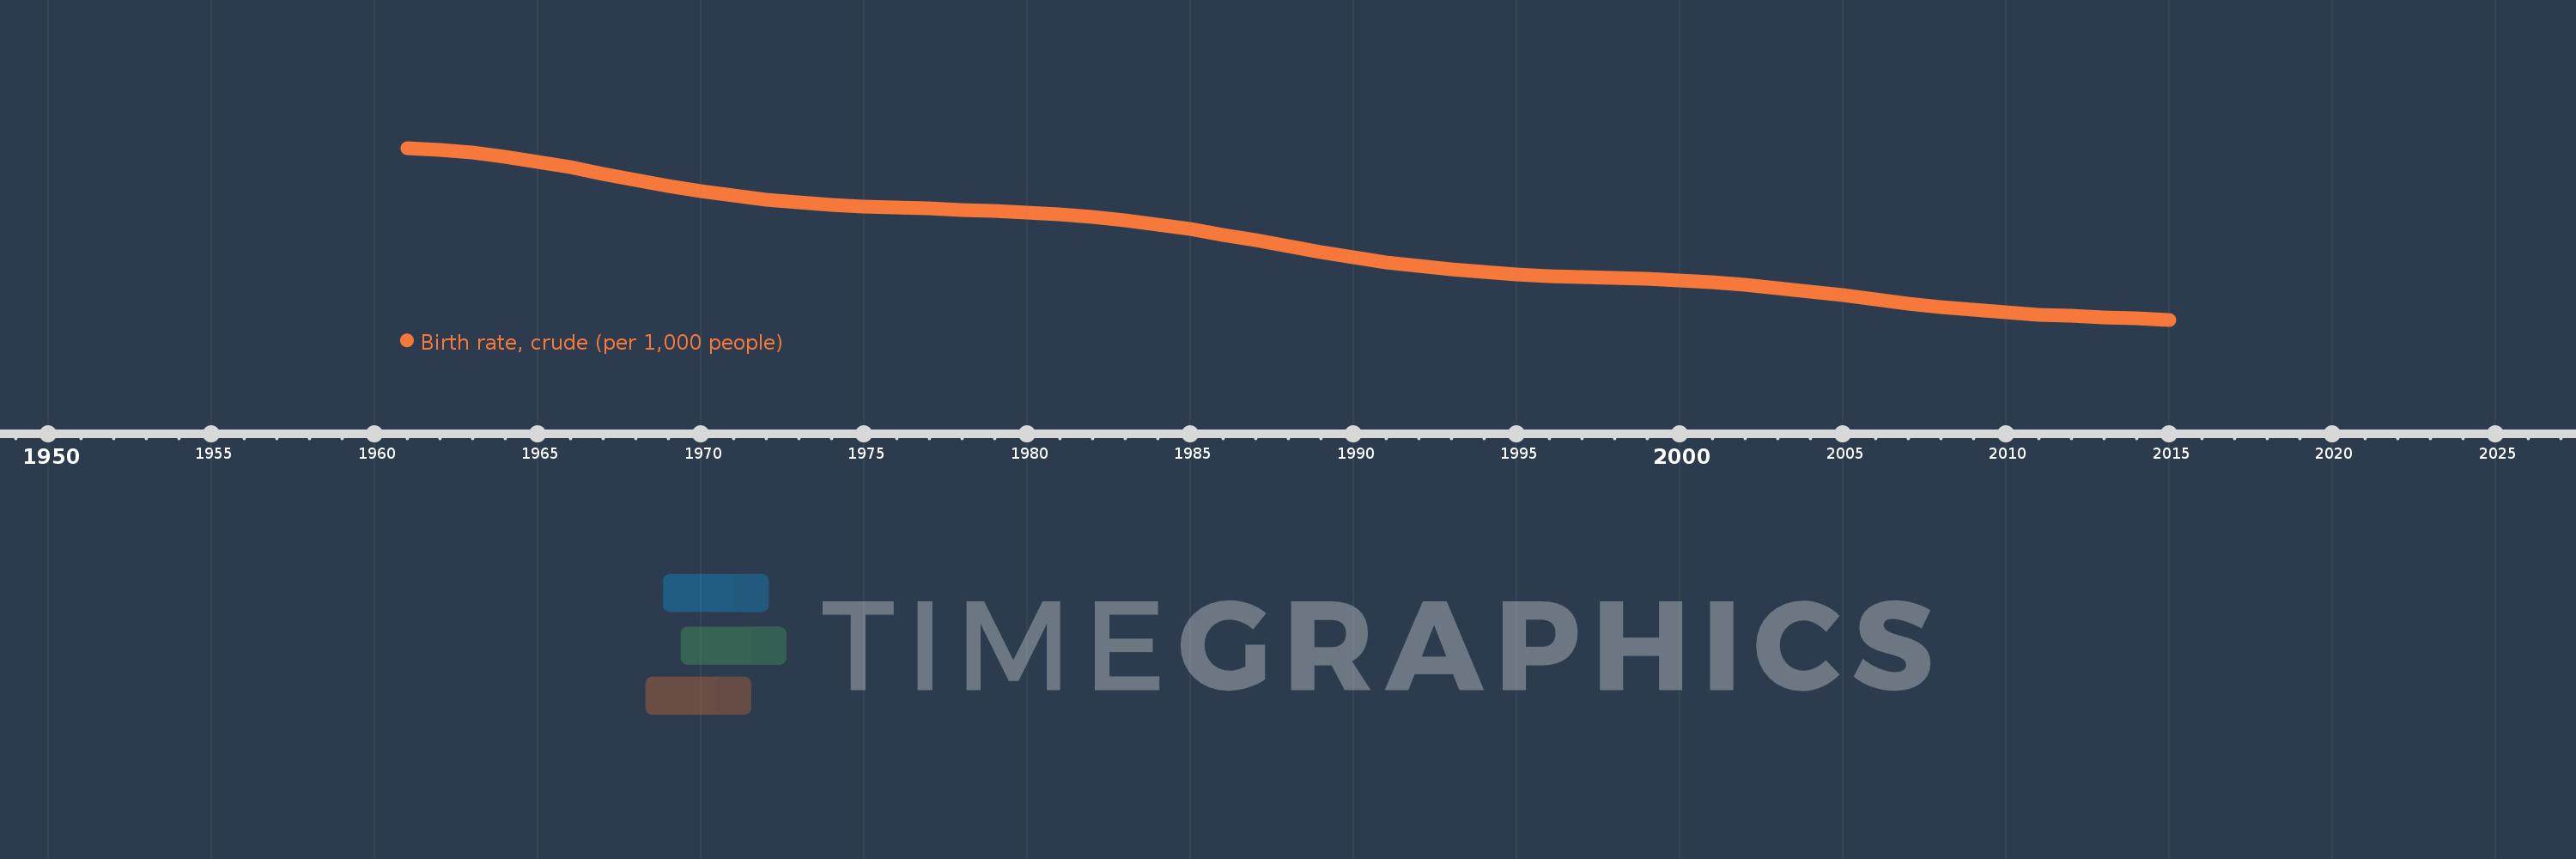
Birth rate, crude (per 1,000 people)
2015,2014,2013,2012,2011,2010,2009,2008,2007,2006,2005,2004,2003,2002,2001,2000,1999,1998,1997,1996,1995,1994,1993,1992,1991,1990,1989,1988,1987,1986,1985,1984,1983,1982,1981,1980,1979,1978,1977,1976,1975,1974,1973,1972,1971,1970,1969,1968,1967,1966,1965,1964,1963,1962,1961
This statistics in other country:
AfghanistanAlbaniaAlgeriaAmerican SamoaAndorraAngolaAntigua and BarbudaArab WorldArgentinaArmeniaArubaAustraliaAustriaAzerbaijanBahamas, TheBahrainBangladeshBarbadosBelarusBelgiumBelizeBeninBermudaBhutanBoliviaBosnia and HerzegovinaBotswanaBrazilBrunei DarussalamBulgariaBurkina FasoBurundiCabo VerdeCambodiaCameroonCanadaCaribbean small statesCayman IslandsCentral African RepublicCentral Europe and the BalticsChadChannel IslandsChileChinaColombiaComorosCongo, Dem. Rep.Congo, Rep.Costa RicaCote d'IvoireCroatiaCubaCuracaoCyprusCzech RepublicDenmarkDjiboutiDominicaDominican RepublicEarly-demographic dividendEast Asia & PacificEast Asia & Pacific (excluding high income)East Asia & Pacific (IDA & IBRD countries)EcuadorEgypt, Arab Rep.El SalvadorEquatorial GuineaEritreaEstoniaEthiopiaEuro areaEurope & Central AsiaEurope & Central Asia (excluding high income)Europe & Central Asia (IDA & IBRD countries)European UnionFaroe IslandsFijiFinlandFragile and conflict affected situationsFranceFrench PolynesiaGabonGambia, TheGeorgiaGermanyGhanaGreeceGreenlandGrenadaGuamGuatemalaGuineaGuinea-BissauGuyanaHaitiHeavily indebted poor countries (HIPC)High incomeHondurasHong Kong SAR, ChinaHungaryIBRD onlyIcelandIDA & IBRD totalIDA blendIDA onlyIDA totalIndiaIndonesiaIran, Islamic Rep.IraqIrelandIsle of ManIsraelItalyJamaicaJapanJordanKazakhstanKenyaKiribatiKorea, Dem. People’s Rep.Korea, Rep.KosovoKuwaitKyrgyz RepublicLao PDRLate-demographic dividendLatin America & Caribbean Latin America & Caribbean (excluding high income)Latin America & the Caribbean (IDA & IBRD countries)LatviaLeast developed countries: UN classificationLebanonLesothoLiberiaLibyaLiechtensteinLithuaniaLow & middle incomeLow incomeLower middle incomeLuxembourgMacao SAR, ChinaMacedonia, FYRMadagascarMalawiMalaysiaMaldivesMaliMaltaMarshall IslandsMauritaniaMauritiusMexicoMicronesia, Fed. Sts.Middle East & North AfricaMiddle East & North Africa (excluding high income)Middle East & North Africa (IDA & IBRD countries)Middle incomeMoldovaMonacoMongoliaMontenegroMoroccoMozambiqueMyanmarNamibiaNepalNetherlandsNew CaledoniaNew ZealandNicaraguaNigerNigeriaNorth AmericaNorwayOECD membersOmanOther small statesPacific island small statesPakistanPalauPanamaPapua New GuineaParaguayPeruPhilippinesPolandPortugalPost-demographic dividendPre-demographic dividendPuerto RicoQatarRomaniaRussian FederationRwandaSamoaSan MarinoSao Tome and PrincipeSaudi ArabiaSenegalSerbiaSeychellesSierra LeoneSingaporeSint Maarten (Dutch part)Slovak RepublicSloveniaSmall statesSolomon IslandsSomaliaSouth AfricaSouth AsiaSouth Asia (IDA & IBRD)South SudanSpainSri LankaSt. Kitts and NevisSt. LuciaSt. Martin (French part)St. Vincent and the GrenadinesSub-Saharan Africa Sub-Saharan Africa (excluding high income)Sub-Saharan Africa (IDA & IBRD countries)SudanSurinameSwazilandSwedenSwitzerlandSyrian Arab RepublicTajikistanTanzaniaThailandTimor-LesteTogoTongaTrinidad and TobagoTunisiaTurkeyTurkmenistanUgandaUkraineUnited Arab EmiratesUnited KingdomUnited StatesUpper middle incomeUruguayUzbekistanVanuatuVenezuela, RBVietnamVirgin Islands (U.S.)West Bank and GazaWorldYemen, Rep.ZambiaZimbabwe Timeline:
This timeline shows a graph from 1961 to 2015 of Brazil. No data until 1960. Number of actual observations by date: 55.
Source name:
World Development Indicators
Source organization:
(1) United Nations Population Division. World Population Prospects, (2) Census reports and other statistical publications from national statistical offices, (3) Eurostat: Demographic Statistics, (4) United Nations Statistical Division. Population and Vital Statistics Reprot (various years), (5) U.S. Census Bureau: International Database, and (6) Secretariat of the Pacific Community: Statistics and Demography Programme.
Categories, topics:
Health
Last updated:
apr 23, 2017
Indicators value changes by year
Minimum:
14.727
jan 1, 2015
Maximum:
43.124
jan 1, 1961
At the date of observation
Value
Absolute change
Change from previous value
jan 1, 1961
43.124
+43.124
0.0%
jan 1, 1962
42.816
-0.308
-0.71%
jan 1, 1963
42.346
-0.47
-1.1%
jan 1, 1964
41.694
-0.652
-1.54%
jan 1, 1965
40.875
-0.819
-1.96%
jan 1, 1966
39.92
-0.955
-2.34%
jan 1, 1967
38.883
-1.037
-2.6%
jan 1, 1968
37.839
-1.044
-2.68%
jan 1, 1969
36.852
-0.987
-2.61%
jan 1, 1970
35.965
-0.887
-2.41%
jan 1, 1971
35.214
-0.751
-2.09%
jan 1, 1972
34.615
-0.599
-1.7%
jan 1, 1973
34.146
-0.469
-1.35%
jan 1, 1974
33.777
-0.369
-1.08%
jan 1, 1975
33.49
-0.287
-0.85%
jan 1, 1976
33.267
-0.223
-0.67%
jan 1, 1977
33.086
-0.181
-0.54%
jan 1, 1978
32.917
-0.169
-0.51%
jan 1, 1979
32.726
-0.191
-0.58%
jan 1, 1980
32.484
-0.242
-0.74%
jan 1, 1981
32.153
-0.331
-1.02%
jan 1, 1982
31.703
-0.45
-1.4%
jan 1, 1983
31.132
-0.571
-1.8%
jan 1, 1984
30.449
-0.683
-2.19%
jan 1, 1985
29.665
-0.784
-2.57%
jan 1, 1986
28.796
-0.869
-2.93%
jan 1, 1987
27.863
-0.933
-3.24%
jan 1, 1988
26.905
-0.958
-3.44%
jan 1, 1989
25.963
-0.942
-3.5%
jan 1, 1990
25.071
-0.892
-3.44%
jan 1, 1991
24.266
-0.805
-3.21%
jan 1, 1992
23.584
-0.682
-2.81%
jan 1, 1993
23.024
-0.56
-2.37%
jan 1, 1994
22.579
-0.445
-1.93%
jan 1, 1995
22.24
-0.339
-1.5%
jan 1, 1996
21.987
-0.253
-1.14%
jan 1, 1997
21.795
-0.192
-0.87%
jan 1, 1998
21.624
-0.171
-0.78%
jan 1, 1999
21.436
-0.188
-0.87%
jan 1, 2000
21.204
-0.232
-1.08%
jan 1, 2001
20.894
-0.31
-1.46%
jan 1, 2002
20.482
-0.412
-1.97%
jan 1, 2003
19.974
-0.508
-2.48%
jan 1, 2004
19.39
-0.584
-2.92%
jan 1, 2005
18.746
-0.644
-3.32%
jan 1, 2006
18.078
-0.668
-3.56%
jan 1, 2007
17.429
-0.649
-3.59%
jan 1, 2008
16.836
-0.593
-3.4%
jan 1, 2009
16.328
-0.508
-3.02%
jan 1, 2010
15.913
-0.415
-2.54%
jan 1, 2011
15.591
-0.322
-2.02%
jan 1, 2012
15.342
-0.249
-1.6%
jan 1, 2013
15.132
-0.21
-1.37%
jan 1, 2014
14.931
-0.201
-1.33%
jan 1, 2015
14.727
-0.204
-1.37%
Ranking of countries by current statistics by years


Comments: