29
/
en
AIzaSyAYiBZKx7MnpbEhh9jyipgxe19OcubqV5w
April 1, 2024
250519
St. Lucia
LCA
true
2
1
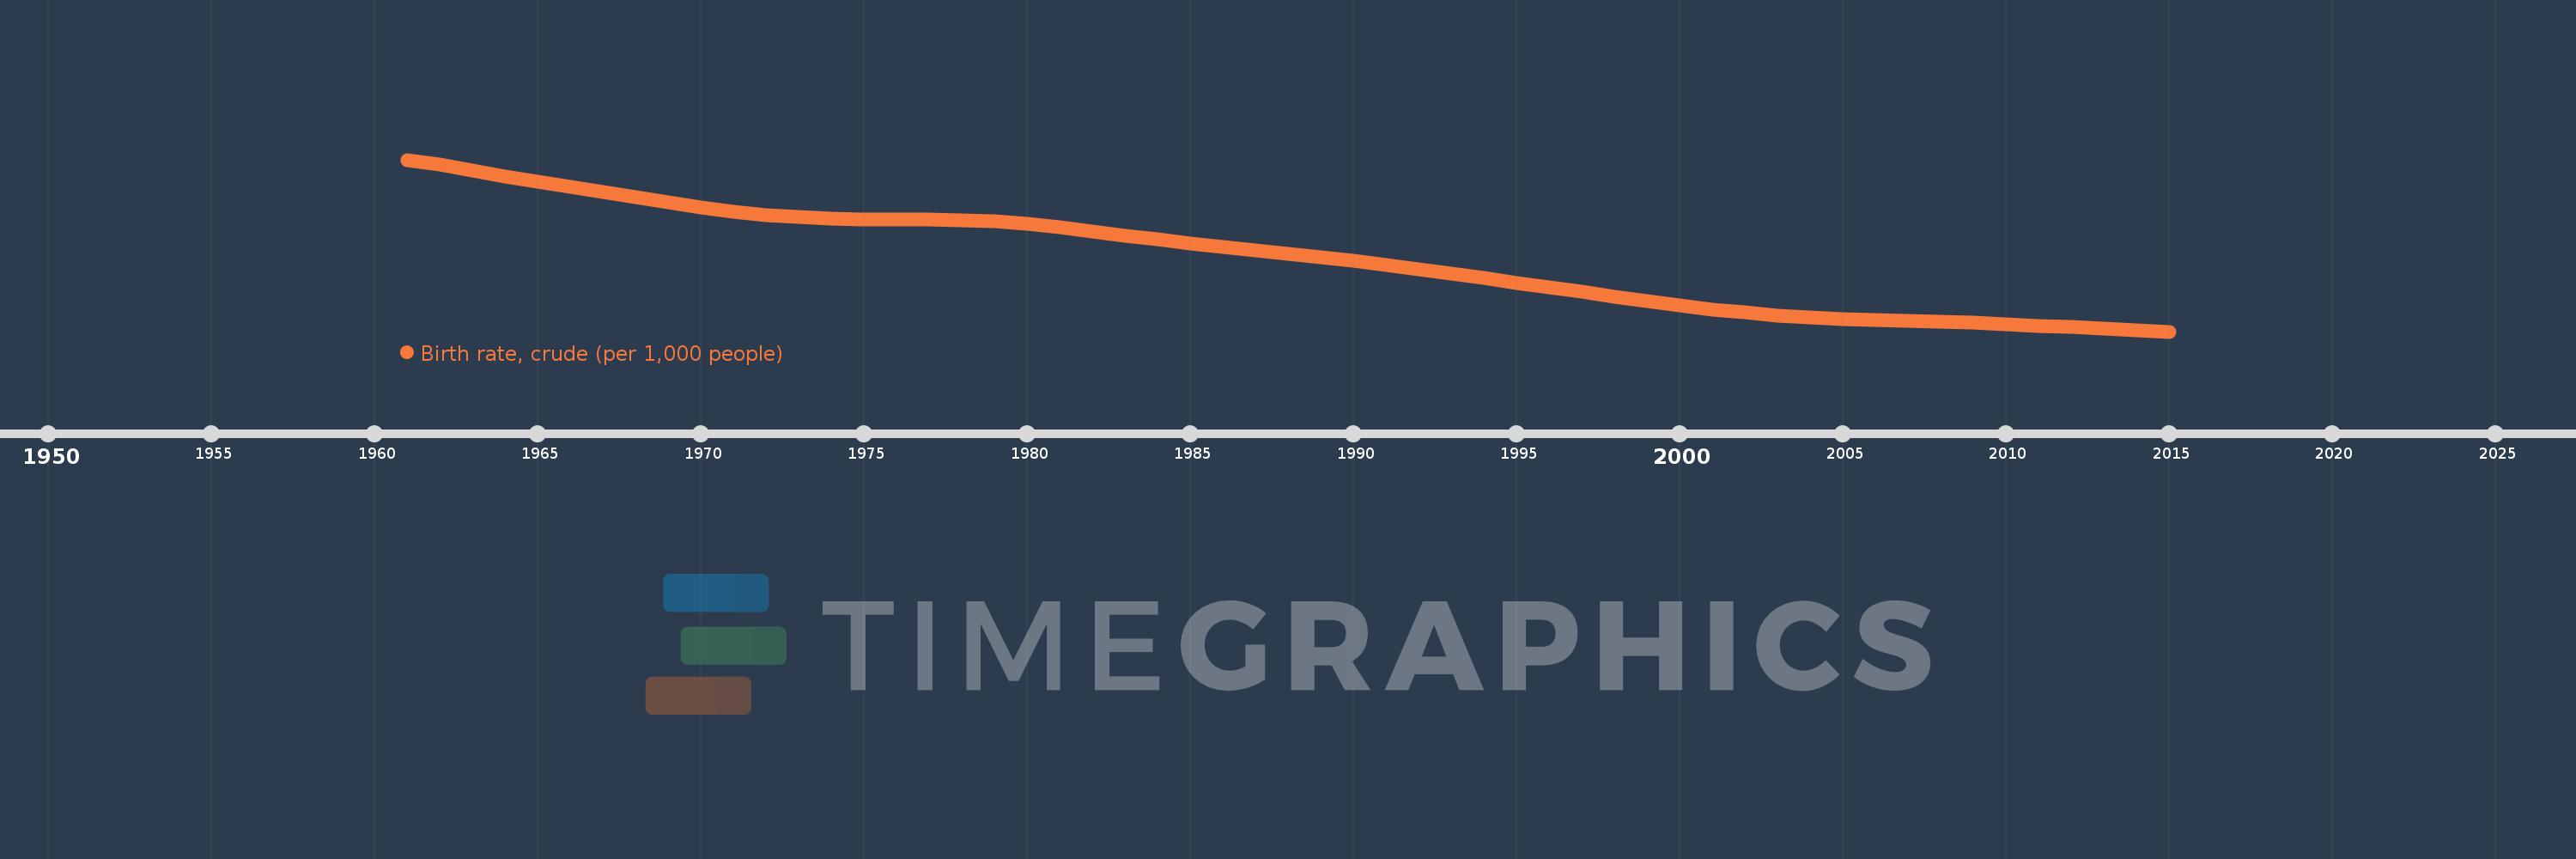
Birth rate, crude (per 1,000 people)
2015,2014,2013,2012,2011,2010,2009,2008,2007,2006,2005,2004,2003,2002,2001,2000,1999,1998,1997,1996,1995,1994,1993,1992,1991,1990,1989,1988,1987,1986,1985,1984,1983,1982,1981,1980,1979,1978,1977,1976,1975,1974,1973,1972,1971,1970,1969,1968,1967,1966,1965,1964,1963,1962,1961
This statistics in other country:
AfghanistanAlbaniaAlgeriaAmerican SamoaAndorraAngolaAntigua and BarbudaArab WorldArgentinaArmeniaArubaAustraliaAustriaAzerbaijanBahamas, TheBahrainBangladeshBarbadosBelarusBelgiumBelizeBeninBermudaBhutanBoliviaBosnia and HerzegovinaBotswanaBrazilBrunei DarussalamBulgariaBurkina FasoBurundiCabo VerdeCambodiaCameroonCanadaCaribbean small statesCayman IslandsCentral African RepublicCentral Europe and the BalticsChadChannel IslandsChileChinaColombiaComorosCongo, Dem. Rep.Congo, Rep.Costa RicaCote d'IvoireCroatiaCubaCuracaoCyprusCzech RepublicDenmarkDjiboutiDominicaDominican RepublicEarly-demographic dividendEast Asia & PacificEast Asia & Pacific (excluding high income)East Asia & Pacific (IDA & IBRD countries)EcuadorEgypt, Arab Rep.El SalvadorEquatorial GuineaEritreaEstoniaEthiopiaEuro areaEurope & Central AsiaEurope & Central Asia (excluding high income)Europe & Central Asia (IDA & IBRD countries)European UnionFaroe IslandsFijiFinlandFragile and conflict affected situationsFranceFrench PolynesiaGabonGambia, TheGeorgiaGermanyGhanaGreeceGreenlandGrenadaGuamGuatemalaGuineaGuinea-BissauGuyanaHaitiHeavily indebted poor countries (HIPC)High incomeHondurasHong Kong SAR, ChinaHungaryIBRD onlyIcelandIDA & IBRD totalIDA blendIDA onlyIDA totalIndiaIndonesiaIran, Islamic Rep.IraqIrelandIsle of ManIsraelItalyJamaicaJapanJordanKazakhstanKenyaKiribatiKorea, Dem. People’s Rep.Korea, Rep.KosovoKuwaitKyrgyz RepublicLao PDRLate-demographic dividendLatin America & Caribbean Latin America & Caribbean (excluding high income)Latin America & the Caribbean (IDA & IBRD countries)LatviaLeast developed countries: UN classificationLebanonLesothoLiberiaLibyaLiechtensteinLithuaniaLow & middle incomeLow incomeLower middle incomeLuxembourgMacao SAR, ChinaMacedonia, FYRMadagascarMalawiMalaysiaMaldivesMaliMaltaMarshall IslandsMauritaniaMauritiusMexicoMicronesia, Fed. Sts.Middle East & North AfricaMiddle East & North Africa (excluding high income)Middle East & North Africa (IDA & IBRD countries)Middle incomeMoldovaMonacoMongoliaMontenegroMoroccoMozambiqueMyanmarNamibiaNepalNetherlandsNew CaledoniaNew ZealandNicaraguaNigerNigeriaNorth AmericaNorwayOECD membersOmanOther small statesPacific island small statesPakistanPalauPanamaPapua New GuineaParaguayPeruPhilippinesPolandPortugalPost-demographic dividendPre-demographic dividendPuerto RicoQatarRomaniaRussian FederationRwandaSamoaSan MarinoSao Tome and PrincipeSaudi ArabiaSenegalSerbiaSeychellesSierra LeoneSingaporeSint Maarten (Dutch part)Slovak RepublicSloveniaSmall statesSolomon IslandsSomaliaSouth AfricaSouth AsiaSouth Asia (IDA & IBRD)South SudanSpainSri LankaSt. Kitts and NevisSt. LuciaSt. Martin (French part)St. Vincent and the GrenadinesSub-Saharan Africa Sub-Saharan Africa (excluding high income)Sub-Saharan Africa (IDA & IBRD countries)SudanSurinameSwazilandSwedenSwitzerlandSyrian Arab RepublicTajikistanTanzaniaThailandTimor-LesteTogoTongaTrinidad and TobagoTunisiaTurkeyTurkmenistanUgandaUkraineUnited Arab EmiratesUnited KingdomUnited StatesUpper middle incomeUruguayUzbekistanVanuatuVenezuela, RBVietnamVirgin Islands (U.S.)West Bank and GazaWorldYemen, Rep.ZambiaZimbabwe Timeline:
This timeline shows a graph from 1961 to 2015 of St. Lucia. No data until 1960. Number of actual observations by date: 55.
Source name:
World Development Indicators
Source organization:
(1) United Nations Population Division. World Population Prospects, (2) Census reports and other statistical publications from national statistical offices, (3) Eurostat: Demographic Statistics, (4) United Nations Statistical Division. Population and Vital Statistics Reprot (various years), (5) U.S. Census Bureau: International Database, and (6) Secretariat of the Pacific Community: Statistics and Demography Programme.
Categories, topics:
Health
Last updated:
apr 23, 2017
Indicators value changes by year
Minimum:
15.168
jan 1, 2015
At the date of observation
Value
Absolute change
Change from previous value
jan 1, 1961
48.9
+48.9
0.0%
jan 1, 1962
47.904
-0.996
-2.04%
jan 1, 1963
46.807
-1.097
-2.29%
jan 1, 1964
45.68
-1.127
-2.41%
jan 1, 1965
44.577
-1.103
-2.41%
jan 1, 1966
43.524
-1.053
-2.36%
jan 1, 1967
42.512
-1.012
-2.33%
jan 1, 1968
41.518
-0.994
-2.34%
jan 1, 1969
40.534
-0.984
-2.37%
jan 1, 1970
39.59
-0.944
-2.33%
jan 1, 1971
38.748
-0.842
-2.13%
jan 1, 1972
38.079
-0.669
-1.73%
jan 1, 1973
37.612
-0.467
-1.23%
jan 1, 1974
37.342
-0.27
-0.72%
jan 1, 1975
37.237
-0.105
-0.28%
jan 1, 1976
37.223
-0.014
-0.04%
jan 1, 1977
37.199
-0.024
-0.06%
jan 1, 1978
37.07
-0.129
-0.35%
jan 1, 1979
36.772
-0.298
-0.8%
jan 1, 1980
36.283
-0.489
-1.33%
jan 1, 1981
35.619
-0.664
-1.83%
jan 1, 1982
34.835
-0.784
-2.2%
jan 1, 1983
34.013
-0.822
-2.36%
jan 1, 1984
33.219
-0.794
-2.33%
jan 1, 1985
32.475
-0.744
-2.24%
jan 1, 1986
31.783
-0.692
-2.13%
jan 1, 1987
31.127
-0.656
-2.06%
jan 1, 1988
30.467
-0.66
-2.12%
jan 1, 1989
29.773
-0.694
-2.28%
jan 1, 1990
29.037
-0.736
-2.47%
jan 1, 1991
28.253
-0.784
-2.7%
jan 1, 1992
27.42
-0.833
-2.95%
jan 1, 1993
26.551
-0.869
-3.17%
jan 1, 1994
25.662
-0.889
-3.35%
jan 1, 1995
24.761
-0.901
-3.51%
jan 1, 1996
23.856
-0.905
-3.65%
jan 1, 1997
22.947
-0.909
-3.81%
jan 1, 1998
22.043
-0.904
-3.94%
jan 1, 1999
21.161
-0.882
-4.0%
jan 1, 2000
20.32
-0.841
-3.97%
jan 1, 2001
19.553
-0.767
-3.77%
jan 1, 2002
18.895
-0.658
-3.37%
jan 1, 2003
18.358
-0.537
-2.84%
jan 1, 2004
17.941
-0.417
-2.27%
jan 1, 2005
17.635
-0.306
-1.71%
jan 1, 2006
17.413
-0.222
-1.26%
jan 1, 2007
17.236
-0.177
-1.02%
jan 1, 2008
17.063
-0.173
-1.0%
jan 1, 2009
16.863
-0.2
-1.17%
jan 1, 2010
16.621
-0.242
-1.44%
jan 1, 2011
16.338
-0.283
-1.7%
jan 1, 2012
16.028
-0.31
-1.9%
jan 1, 2013
15.718
-0.31
-1.93%
jan 1, 2014
15.43
-0.288
-1.83%
jan 1, 2015
15.168
-0.262
-1.7%
Ranking of countries by current statistics by years


Comments: