29
/
en
AIzaSyAYiBZKx7MnpbEhh9jyipgxe19OcubqV5w
April 1, 2024
44077
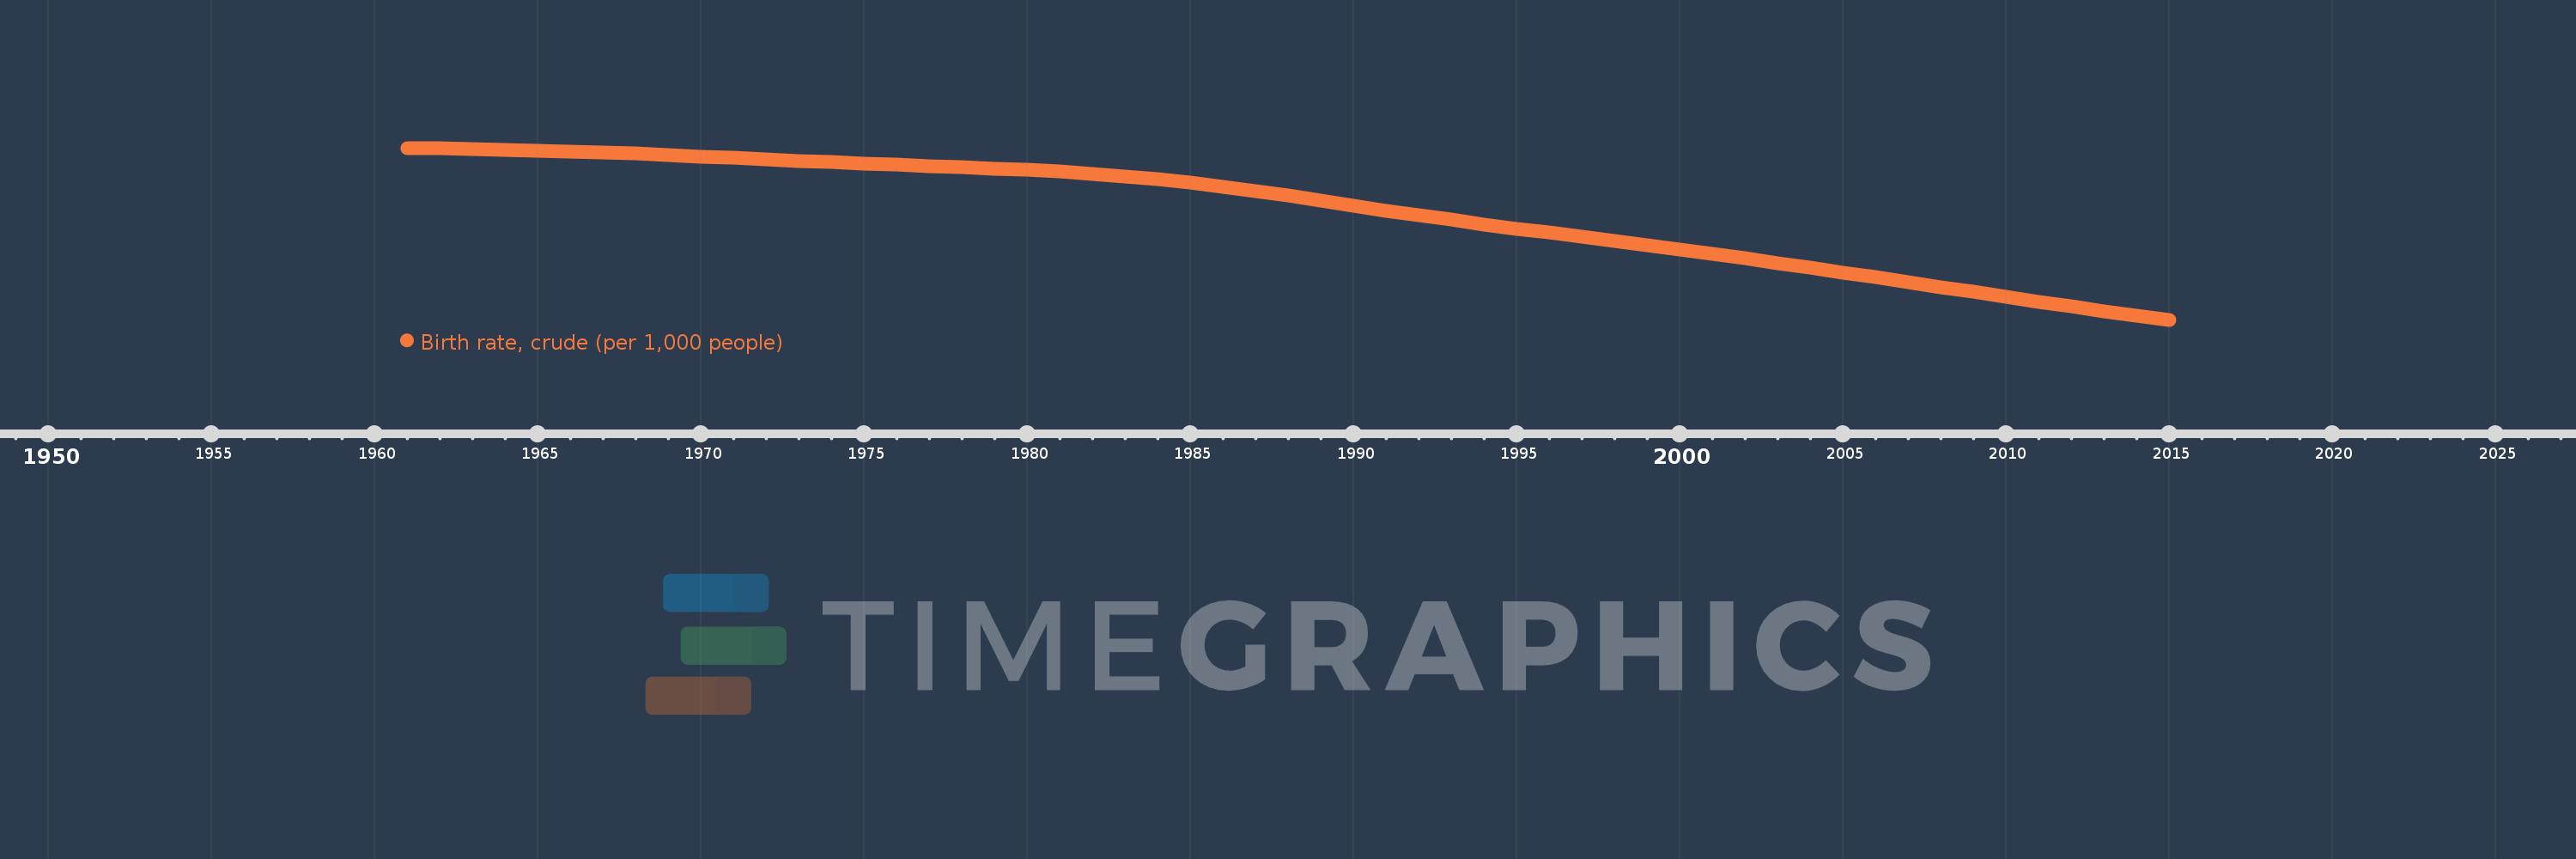
Least developed countries: UN classification
LDC
false
2
1
Birth rate, crude (per 1,000 people)
2015,2014,2013,2012,2011,2010,2009,2008,2007,2006,2005,2004,2003,2002,2001,2000,1999,1998,1997,1996,1995,1994,1993,1992,1991,1990,1989,1988,1987,1986,1985,1984,1983,1982,1981,1980,1979,1978,1977,1976,1975,1974,1973,1972,1971,1970,1969,1968,1967,1966,1965,1964,1963,1962,1961
This statistics in other country:
AfghanistanAlbaniaAlgeriaAmerican SamoaAndorraAngolaAntigua and BarbudaArab WorldArgentinaArmeniaArubaAustraliaAustriaAzerbaijanBahamas, TheBahrainBangladeshBarbadosBelarusBelgiumBelizeBeninBermudaBhutanBoliviaBosnia and HerzegovinaBotswanaBrazilBrunei DarussalamBulgariaBurkina FasoBurundiCabo VerdeCambodiaCameroonCanadaCaribbean small statesCayman IslandsCentral African RepublicCentral Europe and the BalticsChadChannel IslandsChileChinaColombiaComorosCongo, Dem. Rep.Congo, Rep.Costa RicaCote d'IvoireCroatiaCubaCuracaoCyprusCzech RepublicDenmarkDjiboutiDominicaDominican RepublicEarly-demographic dividendEast Asia & PacificEast Asia & Pacific (excluding high income)East Asia & Pacific (IDA & IBRD countries)EcuadorEgypt, Arab Rep.El SalvadorEquatorial GuineaEritreaEstoniaEthiopiaEuro areaEurope & Central AsiaEurope & Central Asia (excluding high income)Europe & Central Asia (IDA & IBRD countries)European UnionFaroe IslandsFijiFinlandFragile and conflict affected situationsFranceFrench PolynesiaGabonGambia, TheGeorgiaGermanyGhanaGreeceGreenlandGrenadaGuamGuatemalaGuineaGuinea-BissauGuyanaHaitiHeavily indebted poor countries (HIPC)High incomeHondurasHong Kong SAR, ChinaHungaryIBRD onlyIcelandIDA & IBRD totalIDA blendIDA onlyIDA totalIndiaIndonesiaIran, Islamic Rep.IraqIrelandIsle of ManIsraelItalyJamaicaJapanJordanKazakhstanKenyaKiribatiKorea, Dem. People’s Rep.Korea, Rep.KosovoKuwaitKyrgyz RepublicLao PDRLate-demographic dividendLatin America & Caribbean Latin America & Caribbean (excluding high income)Latin America & the Caribbean (IDA & IBRD countries)LatviaLeast developed countries: UN classificationLebanonLesothoLiberiaLibyaLiechtensteinLithuaniaLow & middle incomeLow incomeLower middle incomeLuxembourgMacao SAR, ChinaMacedonia, FYRMadagascarMalawiMalaysiaMaldivesMaliMaltaMarshall IslandsMauritaniaMauritiusMexicoMicronesia, Fed. Sts.Middle East & North AfricaMiddle East & North Africa (excluding high income)Middle East & North Africa (IDA & IBRD countries)Middle incomeMoldovaMonacoMongoliaMontenegroMoroccoMozambiqueMyanmarNamibiaNepalNetherlandsNew CaledoniaNew ZealandNicaraguaNigerNigeriaNorth AmericaNorwayOECD membersOmanOther small statesPacific island small statesPakistanPalauPanamaPapua New GuineaParaguayPeruPhilippinesPolandPortugalPost-demographic dividendPre-demographic dividendPuerto RicoQatarRomaniaRussian FederationRwandaSamoaSan MarinoSao Tome and PrincipeSaudi ArabiaSenegalSerbiaSeychellesSierra LeoneSingaporeSint Maarten (Dutch part)Slovak RepublicSloveniaSmall statesSolomon IslandsSomaliaSouth AfricaSouth AsiaSouth Asia (IDA & IBRD)South SudanSpainSri LankaSt. Kitts and NevisSt. LuciaSt. Martin (French part)St. Vincent and the GrenadinesSub-Saharan Africa Sub-Saharan Africa (excluding high income)Sub-Saharan Africa (IDA & IBRD countries)SudanSurinameSwazilandSwedenSwitzerlandSyrian Arab RepublicTajikistanTanzaniaThailandTimor-LesteTogoTongaTrinidad and TobagoTunisiaTurkeyTurkmenistanUgandaUkraineUnited Arab EmiratesUnited KingdomUnited StatesUpper middle incomeUruguayUzbekistanVanuatuVenezuela, RBVietnamVirgin Islands (U.S.)West Bank and GazaWorldYemen, Rep.ZambiaZimbabwe Timeline:
This timeline shows a graph from 1961 to 2015 of Least developed countries: UN classification. No data until 1960. Number of actual observations by date: 55.
Source name:
World Development Indicators
Source organization:
(1) United Nations Population Division. World Population Prospects, (2) Census reports and other statistical publications from national statistical offices, (3) Eurostat: Demographic Statistics, (4) United Nations Statistical Division. Population and Vital Statistics Reprot (various years), (5) U.S. Census Bureau: International Database, and (6) Secretariat of the Pacific Community: Statistics and Demography Programme.
Categories, topics:
Health
Last updated:
apr 23, 2017
Indicators value changes by year
Minimum:
32.759
jan 1, 2015
Maximum:
48.036
jan 1, 1961
At the date of observation
Value
Absolute change
Change from previous value
jan 1, 1961
48.036
+48.036
0.0%
jan 1, 1962
47.994
-0.041
-0.09%
jan 1, 1963
47.942
-0.052
-0.11%
jan 1, 1964
47.879
-0.063
-0.13%
jan 1, 1965
47.805
-0.074
-0.15%
jan 1, 1966
47.719
-0.086
-0.18%
jan 1, 1967
47.623
-0.097
-0.2%
jan 1, 1968
47.517
-0.106
-0.22%
jan 1, 1969
47.403
-0.114
-0.24%
jan 1, 1970
47.282
-0.121
-0.25%
jan 1, 1971
47.157
-0.124
-0.26%
jan 1, 1972
47.031
-0.127
-0.27%
jan 1, 1973
46.904
-0.127
-0.27%
jan 1, 1974
46.777
-0.126
-0.27%
jan 1, 1975
46.652
-0.125
-0.27%
jan 1, 1976
46.533
-0.12
-0.26%
jan 1, 1977
46.421
-0.112
-0.24%
jan 1, 1978
46.313
-0.108
-0.23%
jan 1, 1979
46.201
-0.112
-0.24%
jan 1, 1980
46.075
-0.126
-0.27%
jan 1, 1981
45.924
-0.151
-0.33%
jan 1, 1982
45.739
-0.185
-0.4%
jan 1, 1983
45.514
-0.225
-0.49%
jan 1, 1984
45.248
-0.266
-0.59%
jan 1, 1985
44.94
-0.309
-0.68%
jan 1, 1986
44.59
-0.35
-0.78%
jan 1, 1987
44.202
-0.388
-0.87%
jan 1, 1988
43.786
-0.416
-0.94%
jan 1, 1989
43.353
-0.432
-0.99%
jan 1, 1990
42.912
-0.441
-1.02%
jan 1, 1991
42.474
-0.438
-1.02%
jan 1, 1992
42.048
-0.426
-1.0%
jan 1, 1993
41.639
-0.409
-0.97%
jan 1, 1994
41.246
-0.393
-0.94%
jan 1, 1995
40.866
-0.38
-0.92%
jan 1, 1996
40.494
-0.372
-0.91%
jan 1, 1997
40.125
-0.369
-0.91%
jan 1, 1998
39.753
-0.372
-0.93%
jan 1, 1999
39.375
-0.378
-0.95%
jan 1, 2000
38.993
-0.382
-0.97%
jan 1, 2001
38.605
-0.388
-1.0%
jan 1, 2002
38.209
-0.396
-1.03%
jan 1, 2003
37.805
-0.404
-1.06%
jan 1, 2004
37.394
-0.412
-1.09%
jan 1, 2005
36.974
-0.42
-1.12%
jan 1, 2006
36.546
-0.428
-1.16%
jan 1, 2007
36.11
-0.436
-1.19%
jan 1, 2008
35.669
-0.441
-1.22%
jan 1, 2009
35.227
-0.442
-1.24%
jan 1, 2010
34.786
-0.441
-1.25%
jan 1, 2011
34.352
-0.434
-1.25%
jan 1, 2012
33.93
-0.422
-1.23%
jan 1, 2013
33.523
-0.407
-1.2%
jan 1, 2014
33.132
-0.391
-1.16%
jan 1, 2015
32.759
-0.373
-1.13%
Ranking of countries by current statistics by years


Comments: