29
/
en
AIzaSyAYiBZKx7MnpbEhh9jyipgxe19OcubqV5w
April 1, 2024
24703
Caribbean small states
CSS
false
2
1
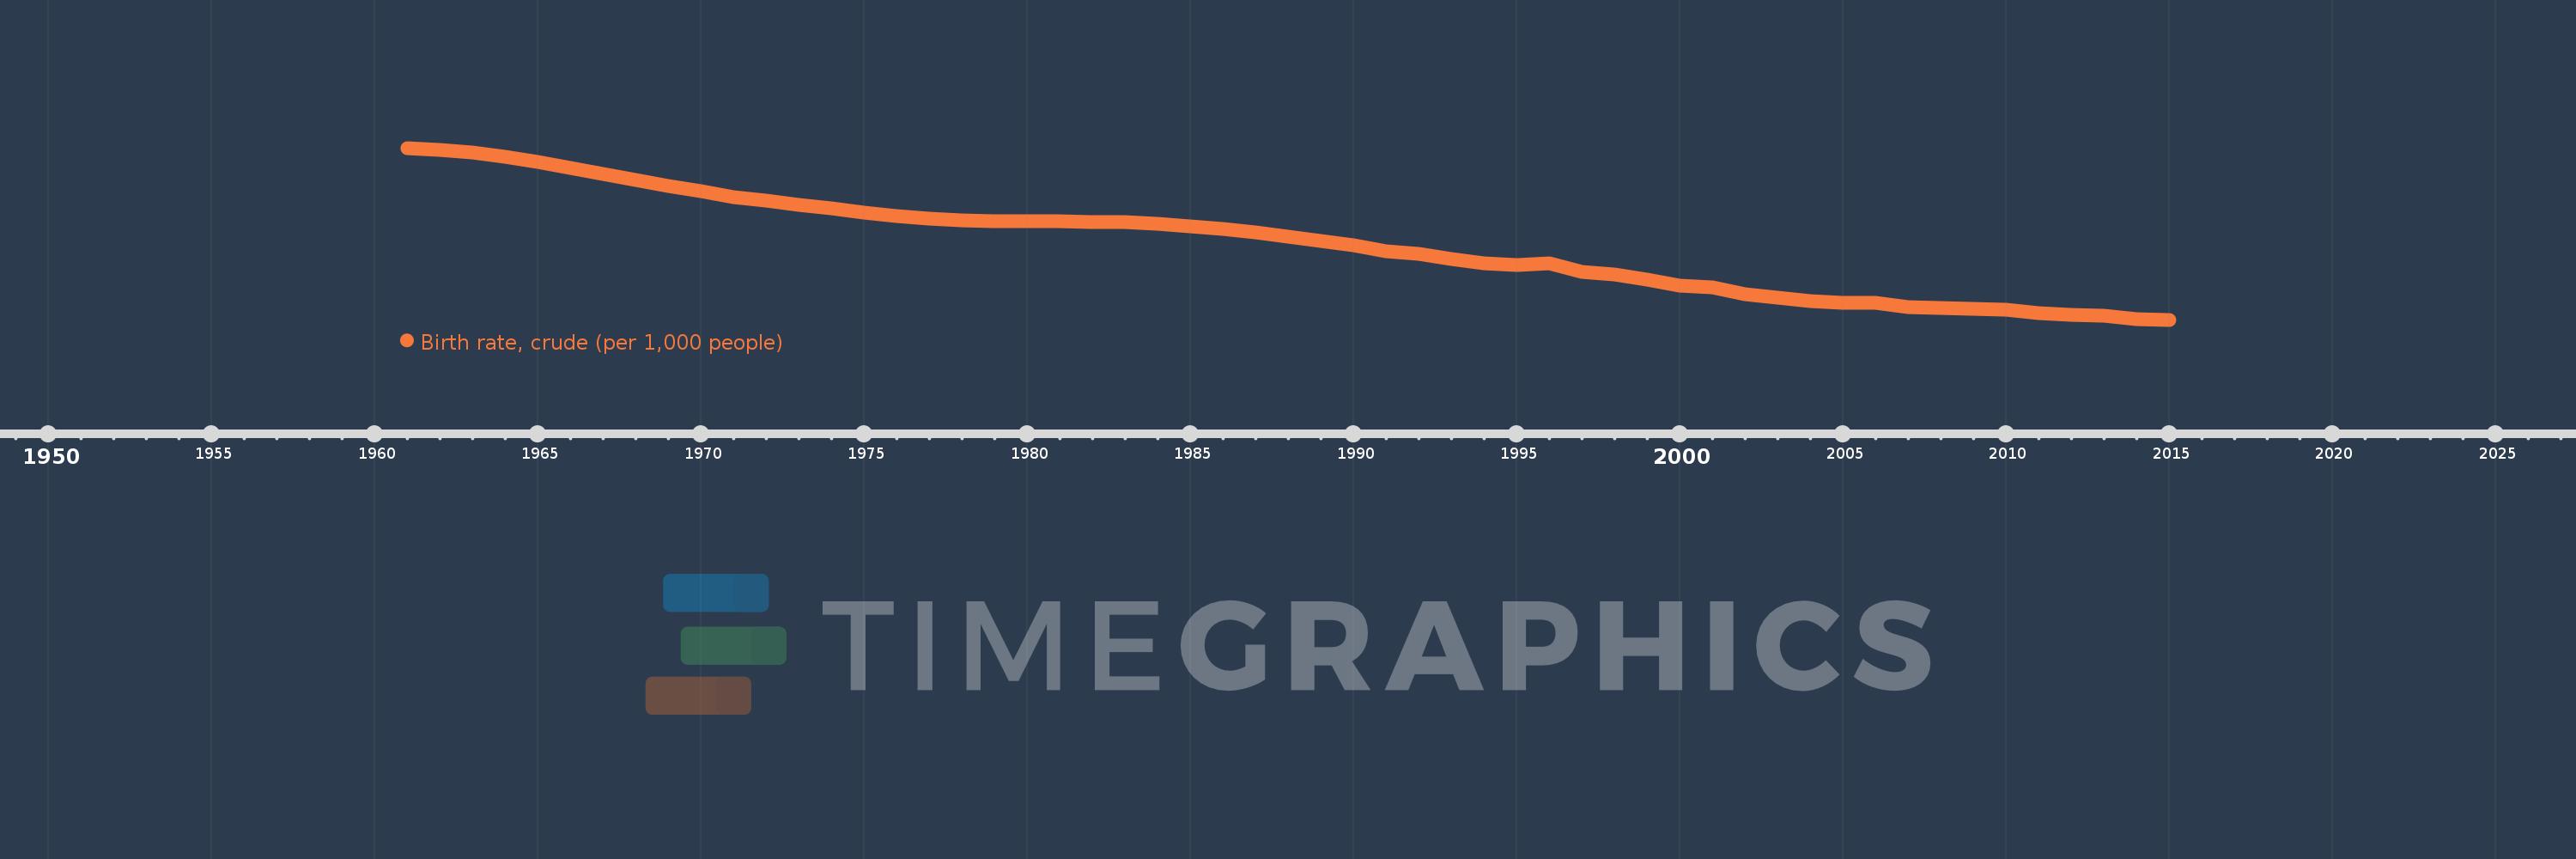
Birth rate, crude (per 1,000 people)
2015,2014,2013,2012,2011,2010,2009,2008,2007,2006,2005,2004,2003,2002,2001,2000,1999,1998,1997,1996,1995,1994,1993,1992,1991,1990,1989,1988,1987,1986,1985,1984,1983,1982,1981,1980,1979,1978,1977,1976,1975,1974,1973,1972,1971,1970,1969,1968,1967,1966,1965,1964,1963,1962,1961
This statistics in other country:
AfghanistanAlbaniaAlgeriaAmerican SamoaAndorraAngolaAntigua and BarbudaArab WorldArgentinaArmeniaArubaAustraliaAustriaAzerbaijanBahamas, TheBahrainBangladeshBarbadosBelarusBelgiumBelizeBeninBermudaBhutanBoliviaBosnia and HerzegovinaBotswanaBrazilBrunei DarussalamBulgariaBurkina FasoBurundiCabo VerdeCambodiaCameroonCanadaCaribbean small statesCayman IslandsCentral African RepublicCentral Europe and the BalticsChadChannel IslandsChileChinaColombiaComorosCongo, Dem. Rep.Congo, Rep.Costa RicaCote d'IvoireCroatiaCubaCuracaoCyprusCzech RepublicDenmarkDjiboutiDominicaDominican RepublicEarly-demographic dividendEast Asia & PacificEast Asia & Pacific (excluding high income)East Asia & Pacific (IDA & IBRD countries)EcuadorEgypt, Arab Rep.El SalvadorEquatorial GuineaEritreaEstoniaEthiopiaEuro areaEurope & Central AsiaEurope & Central Asia (excluding high income)Europe & Central Asia (IDA & IBRD countries)European UnionFaroe IslandsFijiFinlandFragile and conflict affected situationsFranceFrench PolynesiaGabonGambia, TheGeorgiaGermanyGhanaGreeceGreenlandGrenadaGuamGuatemalaGuineaGuinea-BissauGuyanaHaitiHeavily indebted poor countries (HIPC)High incomeHondurasHong Kong SAR, ChinaHungaryIBRD onlyIcelandIDA & IBRD totalIDA blendIDA onlyIDA totalIndiaIndonesiaIran, Islamic Rep.IraqIrelandIsle of ManIsraelItalyJamaicaJapanJordanKazakhstanKenyaKiribatiKorea, Dem. People’s Rep.Korea, Rep.KosovoKuwaitKyrgyz RepublicLao PDRLate-demographic dividendLatin America & Caribbean Latin America & Caribbean (excluding high income)Latin America & the Caribbean (IDA & IBRD countries)LatviaLeast developed countries: UN classificationLebanonLesothoLiberiaLibyaLiechtensteinLithuaniaLow & middle incomeLow incomeLower middle incomeLuxembourgMacao SAR, ChinaMacedonia, FYRMadagascarMalawiMalaysiaMaldivesMaliMaltaMarshall IslandsMauritaniaMauritiusMexicoMicronesia, Fed. Sts.Middle East & North AfricaMiddle East & North Africa (excluding high income)Middle East & North Africa (IDA & IBRD countries)Middle incomeMoldovaMonacoMongoliaMontenegroMoroccoMozambiqueMyanmarNamibiaNepalNetherlandsNew CaledoniaNew ZealandNicaraguaNigerNigeriaNorth AmericaNorwayOECD membersOmanOther small statesPacific island small statesPakistanPalauPanamaPapua New GuineaParaguayPeruPhilippinesPolandPortugalPost-demographic dividendPre-demographic dividendPuerto RicoQatarRomaniaRussian FederationRwandaSamoaSan MarinoSao Tome and PrincipeSaudi ArabiaSenegalSerbiaSeychellesSierra LeoneSingaporeSint Maarten (Dutch part)Slovak RepublicSloveniaSmall statesSolomon IslandsSomaliaSouth AfricaSouth AsiaSouth Asia (IDA & IBRD)South SudanSpainSri LankaSt. Kitts and NevisSt. LuciaSt. Martin (French part)St. Vincent and the GrenadinesSub-Saharan Africa Sub-Saharan Africa (excluding high income)Sub-Saharan Africa (IDA & IBRD countries)SudanSurinameSwazilandSwedenSwitzerlandSyrian Arab RepublicTajikistanTanzaniaThailandTimor-LesteTogoTongaTrinidad and TobagoTunisiaTurkeyTurkmenistanUgandaUkraineUnited Arab EmiratesUnited KingdomUnited StatesUpper middle incomeUruguayUzbekistanVanuatuVenezuela, RBVietnamVirgin Islands (U.S.)West Bank and GazaWorldYemen, Rep.ZambiaZimbabwe Timeline:
This timeline shows a graph from 1961 to 2015 of Caribbean small states. No data until 1960. Number of actual observations by date: 55.
Source name:
World Development Indicators
Source organization:
(1) United Nations Population Division. World Population Prospects, (2) Census reports and other statistical publications from national statistical offices, (3) Eurostat: Demographic Statistics, (4) United Nations Statistical Division. Population and Vital Statistics Reprot (various years), (5) U.S. Census Bureau: International Database, and (6) Secretariat of the Pacific Community: Statistics and Demography Programme.
Categories, topics:
Health
Last updated:
apr 23, 2017
Indicators value changes by year
Minimum:
15.387
jan 1, 2015
Maximum:
40.017
jan 1, 1961
At the date of observation
Value
Absolute change
Change from previous value
jan 1, 1961
40.017
+40.017
0.0%
jan 1, 1962
39.745
-0.272
-0.68%
jan 1, 1963
39.313
-0.432
-1.09%
jan 1, 1964
38.726
-0.587
-1.49%
jan 1, 1965
38.005
-0.72
-1.86%
jan 1, 1966
37.186
-0.82
-2.16%
jan 1, 1967
36.311
-0.874
-2.35%
jan 1, 1968
35.429
-0.882
-2.43%
jan 1, 1969
34.581
-0.848
-2.39%
jan 1, 1970
33.794
-0.787
-2.28%
jan 1, 1971
32.907
-0.887
-2.62%
jan 1, 1972
32.434
-0.473
-1.44%
jan 1, 1973
31.912
-0.522
-1.61%
jan 1, 1974
31.3
-0.612
-1.92%
jan 1, 1975
30.747
-0.552
-1.77%
jan 1, 1976
30.259
-0.488
-1.59%
jan 1, 1977
29.899
-0.36
-1.19%
jan 1, 1978
29.678
-0.221
-0.74%
jan 1, 1979
29.526
-0.152
-0.51%
jan 1, 1980
29.465
-0.061
-0.21%
jan 1, 1981
29.491
+0.026
0.09%
jan 1, 1982
29.413
-0.078
-0.27%
jan 1, 1983
29.341
-0.071
-0.24%
jan 1, 1984
29.11
-0.231
-0.79%
jan 1, 1985
28.753
-0.357
-1.23%
jan 1, 1986
28.402
-0.352
-1.22%
jan 1, 1987
27.868
-0.534
-1.88%
jan 1, 1988
27.242
-0.626
-2.25%
jan 1, 1989
26.673
-0.569
-2.09%
jan 1, 1990
26.089
-0.585
-2.19%
jan 1, 1991
25.258
-0.831
-3.19%
jan 1, 1992
24.841
-0.416
-1.65%
jan 1, 1993
24.096
-0.745
-3.0%
jan 1, 1994
23.435
-0.661
-2.74%
jan 1, 1995
23.236
-0.2
-0.85%
jan 1, 1996
23.43
+0.194
0.84%
jan 1, 1997
22.246
-1.184
-5.05%
jan 1, 1998
21.928
-0.318
-1.43%
jan 1, 1999
21.107
-0.821
-3.74%
jan 1, 2000
20.325
-0.782
-3.71%
jan 1, 2001
20.045
-0.28
-1.38%
jan 1, 2002
19.09
-0.955
-4.76%
jan 1, 2003
18.552
-0.538
-2.82%
jan 1, 2004
18.098
-0.454
-2.45%
jan 1, 2005
17.802
-0.296
-1.64%
jan 1, 2006
17.871
+0.069
0.39%
jan 1, 2007
17.217
-0.654
-3.66%
jan 1, 2008
17.123
-0.094
-0.54%
jan 1, 2009
16.958
-0.165
-0.96%
jan 1, 2010
16.787
-0.171
-1.01%
jan 1, 2011
16.295
-0.492
-2.93%
jan 1, 2012
16.095
-0.2
-1.23%
jan 1, 2013
15.945
-0.15
-0.93%
jan 1, 2014
15.469
-0.476
-2.99%
jan 1, 2015
15.387
-0.083
-0.53%
Ranking of countries by current statistics by years


Comments: