29
/
en
AIzaSyAYiBZKx7MnpbEhh9jyipgxe19OcubqV5w
April 1, 2024
106914
Colombia
COL
true
2
1
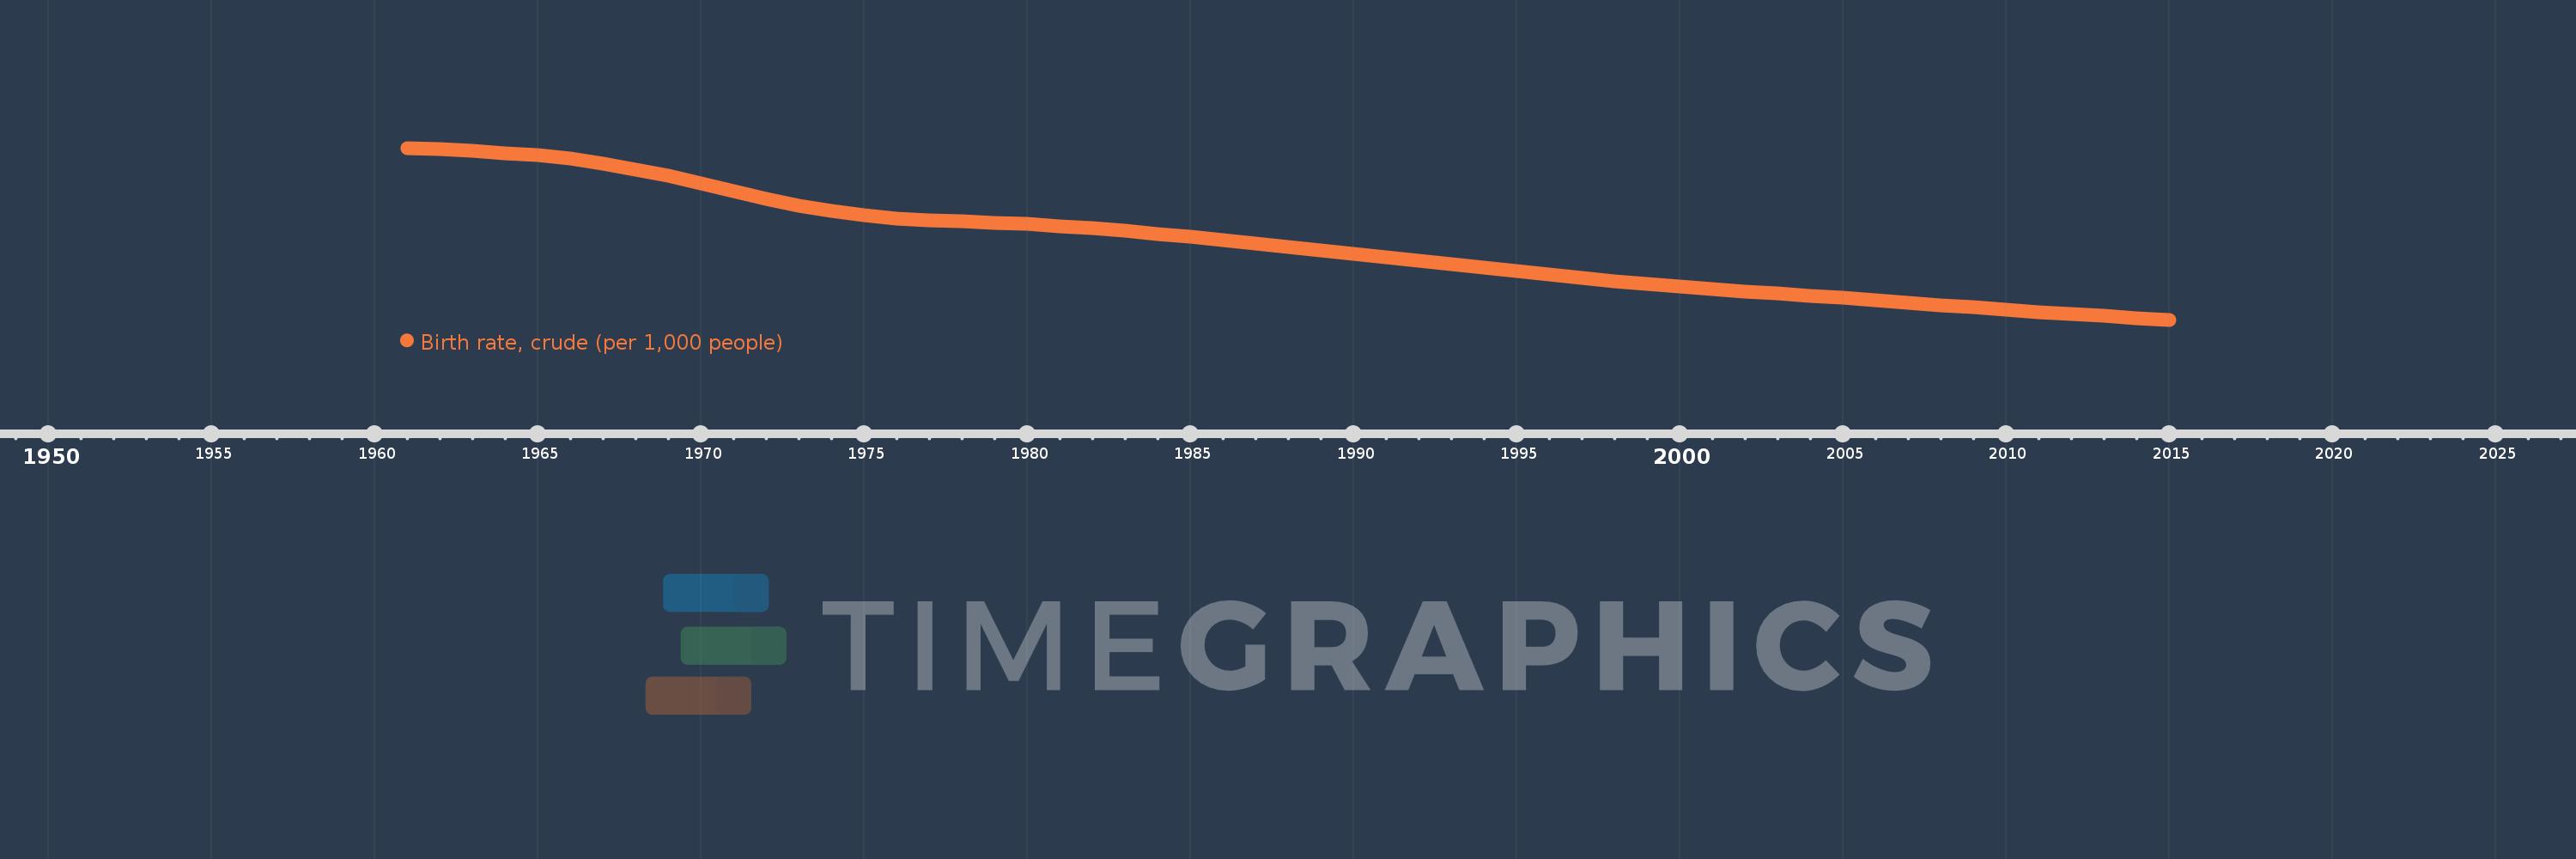
Birth rate, crude (per 1,000 people)
2015,2014,2013,2012,2011,2010,2009,2008,2007,2006,2005,2004,2003,2002,2001,2000,1999,1998,1997,1996,1995,1994,1993,1992,1991,1990,1989,1988,1987,1986,1985,1984,1983,1982,1981,1980,1979,1978,1977,1976,1975,1974,1973,1972,1971,1970,1969,1968,1967,1966,1965,1964,1963,1962,1961
This statistics in other country:
AfghanistanAlbaniaAlgeriaAmerican SamoaAndorraAngolaAntigua and BarbudaArab WorldArgentinaArmeniaArubaAustraliaAustriaAzerbaijanBahamas, TheBahrainBangladeshBarbadosBelarusBelgiumBelizeBeninBermudaBhutanBoliviaBosnia and HerzegovinaBotswanaBrazilBrunei DarussalamBulgariaBurkina FasoBurundiCabo VerdeCambodiaCameroonCanadaCaribbean small statesCayman IslandsCentral African RepublicCentral Europe and the BalticsChadChannel IslandsChileChinaColombiaComorosCongo, Dem. Rep.Congo, Rep.Costa RicaCote d'IvoireCroatiaCubaCuracaoCyprusCzech RepublicDenmarkDjiboutiDominicaDominican RepublicEarly-demographic dividendEast Asia & PacificEast Asia & Pacific (excluding high income)East Asia & Pacific (IDA & IBRD countries)EcuadorEgypt, Arab Rep.El SalvadorEquatorial GuineaEritreaEstoniaEthiopiaEuro areaEurope & Central AsiaEurope & Central Asia (excluding high income)Europe & Central Asia (IDA & IBRD countries)European UnionFaroe IslandsFijiFinlandFragile and conflict affected situationsFranceFrench PolynesiaGabonGambia, TheGeorgiaGermanyGhanaGreeceGreenlandGrenadaGuamGuatemalaGuineaGuinea-BissauGuyanaHaitiHeavily indebted poor countries (HIPC)High incomeHondurasHong Kong SAR, ChinaHungaryIBRD onlyIcelandIDA & IBRD totalIDA blendIDA onlyIDA totalIndiaIndonesiaIran, Islamic Rep.IraqIrelandIsle of ManIsraelItalyJamaicaJapanJordanKazakhstanKenyaKiribatiKorea, Dem. People’s Rep.Korea, Rep.KosovoKuwaitKyrgyz RepublicLao PDRLate-demographic dividendLatin America & Caribbean Latin America & Caribbean (excluding high income)Latin America & the Caribbean (IDA & IBRD countries)LatviaLeast developed countries: UN classificationLebanonLesothoLiberiaLibyaLiechtensteinLithuaniaLow & middle incomeLow incomeLower middle incomeLuxembourgMacao SAR, ChinaMacedonia, FYRMadagascarMalawiMalaysiaMaldivesMaliMaltaMarshall IslandsMauritaniaMauritiusMexicoMicronesia, Fed. Sts.Middle East & North AfricaMiddle East & North Africa (excluding high income)Middle East & North Africa (IDA & IBRD countries)Middle incomeMoldovaMonacoMongoliaMontenegroMoroccoMozambiqueMyanmarNamibiaNepalNetherlandsNew CaledoniaNew ZealandNicaraguaNigerNigeriaNorth AmericaNorwayOECD membersOmanOther small statesPacific island small statesPakistanPalauPanamaPapua New GuineaParaguayPeruPhilippinesPolandPortugalPost-demographic dividendPre-demographic dividendPuerto RicoQatarRomaniaRussian FederationRwandaSamoaSan MarinoSao Tome and PrincipeSaudi ArabiaSenegalSerbiaSeychellesSierra LeoneSingaporeSint Maarten (Dutch part)Slovak RepublicSloveniaSmall statesSolomon IslandsSomaliaSouth AfricaSouth AsiaSouth Asia (IDA & IBRD)South SudanSpainSri LankaSt. Kitts and NevisSt. LuciaSt. Martin (French part)St. Vincent and the GrenadinesSub-Saharan Africa Sub-Saharan Africa (excluding high income)Sub-Saharan Africa (IDA & IBRD countries)SudanSurinameSwazilandSwedenSwitzerlandSyrian Arab RepublicTajikistanTanzaniaThailandTimor-LesteTogoTongaTrinidad and TobagoTunisiaTurkeyTurkmenistanUgandaUkraineUnited Arab EmiratesUnited KingdomUnited StatesUpper middle incomeUruguayUzbekistanVanuatuVenezuela, RBVietnamVirgin Islands (U.S.)West Bank and GazaWorldYemen, Rep.ZambiaZimbabwe Timeline:
This timeline shows a graph from 1961 to 2015 of Colombia. No data until 1960. Number of actual observations by date: 55.
Source name:
World Development Indicators
Source organization:
(1) United Nations Population Division. World Population Prospects, (2) Census reports and other statistical publications from national statistical offices, (3) Eurostat: Demographic Statistics, (4) United Nations Statistical Division. Population and Vital Statistics Reprot (various years), (5) U.S. Census Bureau: International Database, and (6) Secretariat of the Pacific Community: Statistics and Demography Programme.
Categories, topics:
Health
Last updated:
apr 23, 2017
Indicators value changes by year
Minimum:
15.773
jan 1, 2015
Maximum:
44.904
jan 1, 1961
At the date of observation
Value
Absolute change
Change from previous value
jan 1, 1961
44.904
+44.904
0.0%
jan 1, 1962
44.667
-0.237
-0.53%
jan 1, 1963
44.394
-0.273
-0.61%
jan 1, 1964
44.056
-0.338
-0.76%
jan 1, 1965
43.625
-0.431
-0.98%
jan 1, 1966
43.047
-0.578
-1.32%
jan 1, 1967
42.269
-0.778
-1.81%
jan 1, 1968
41.286
-0.983
-2.33%
jan 1, 1969
40.129
-1.157
-2.8%
jan 1, 1970
38.84
-1.289
-3.21%
jan 1, 1971
37.506
-1.334
-3.43%
jan 1, 1972
36.229
-1.277
-3.4%
jan 1, 1973
35.095
-1.134
-3.13%
jan 1, 1974
34.166
-0.929
-2.65%
jan 1, 1975
33.461
-0.705
-2.06%
jan 1, 1976
32.974
-0.487
-1.46%
jan 1, 1977
32.662
-0.312
-0.95%
jan 1, 1978
32.437
-0.225
-0.69%
jan 1, 1979
32.223
-0.214
-0.66%
jan 1, 1980
31.98
-0.243
-0.75%
jan 1, 1981
31.675
-0.305
-0.95%
jan 1, 1982
31.293
-0.382
-1.21%
jan 1, 1983
30.848
-0.445
-1.42%
jan 1, 1984
30.357
-0.491
-1.59%
jan 1, 1985
29.823
-0.534
-1.76%
jan 1, 1986
29.255
-0.568
-1.9%
jan 1, 1987
28.671
-0.584
-2.0%
jan 1, 1988
28.086
-0.585
-2.04%
jan 1, 1989
27.511
-0.575
-2.05%
jan 1, 1990
26.952
-0.559
-2.03%
jan 1, 1991
26.401
-0.551
-2.04%
jan 1, 1992
25.843
-0.558
-2.11%
jan 1, 1993
25.267
-0.576
-2.23%
jan 1, 1994
24.667
-0.6
-2.37%
jan 1, 1995
24.051
-0.616
-2.5%
jan 1, 1996
23.435
-0.616
-2.56%
jan 1, 1997
22.843
-0.592
-2.53%
jan 1, 1998
22.293
-0.55
-2.41%
jan 1, 1999
21.796
-0.497
-2.23%
jan 1, 2000
21.355
-0.441
-2.02%
jan 1, 2001
20.959
-0.396
-1.85%
jan 1, 2002
20.593
-0.366
-1.75%
jan 1, 2003
20.234
-0.359
-1.74%
jan 1, 2004
19.865
-0.369
-1.82%
jan 1, 2005
19.48
-0.385
-1.94%
jan 1, 2006
19.078
-0.402
-2.06%
jan 1, 2007
18.663
-0.415
-2.18%
jan 1, 2008
18.247
-0.416
-2.23%
jan 1, 2009
17.842
-0.405
-2.22%
jan 1, 2010
17.451
-0.391
-2.19%
jan 1, 2011
17.079
-0.372
-2.13%
jan 1, 2012
16.727
-0.352
-2.06%
jan 1, 2013
16.393
-0.334
-2.0%
jan 1, 2014
16.076
-0.317
-1.93%
jan 1, 2015
15.773
-0.303
-1.88%
Ranking of countries by current statistics by years


Comments: