29
/
en
AIzaSyAYiBZKx7MnpbEhh9jyipgxe19OcubqV5w
April 1, 2024
227190
Qatar
QAT
true
2
1
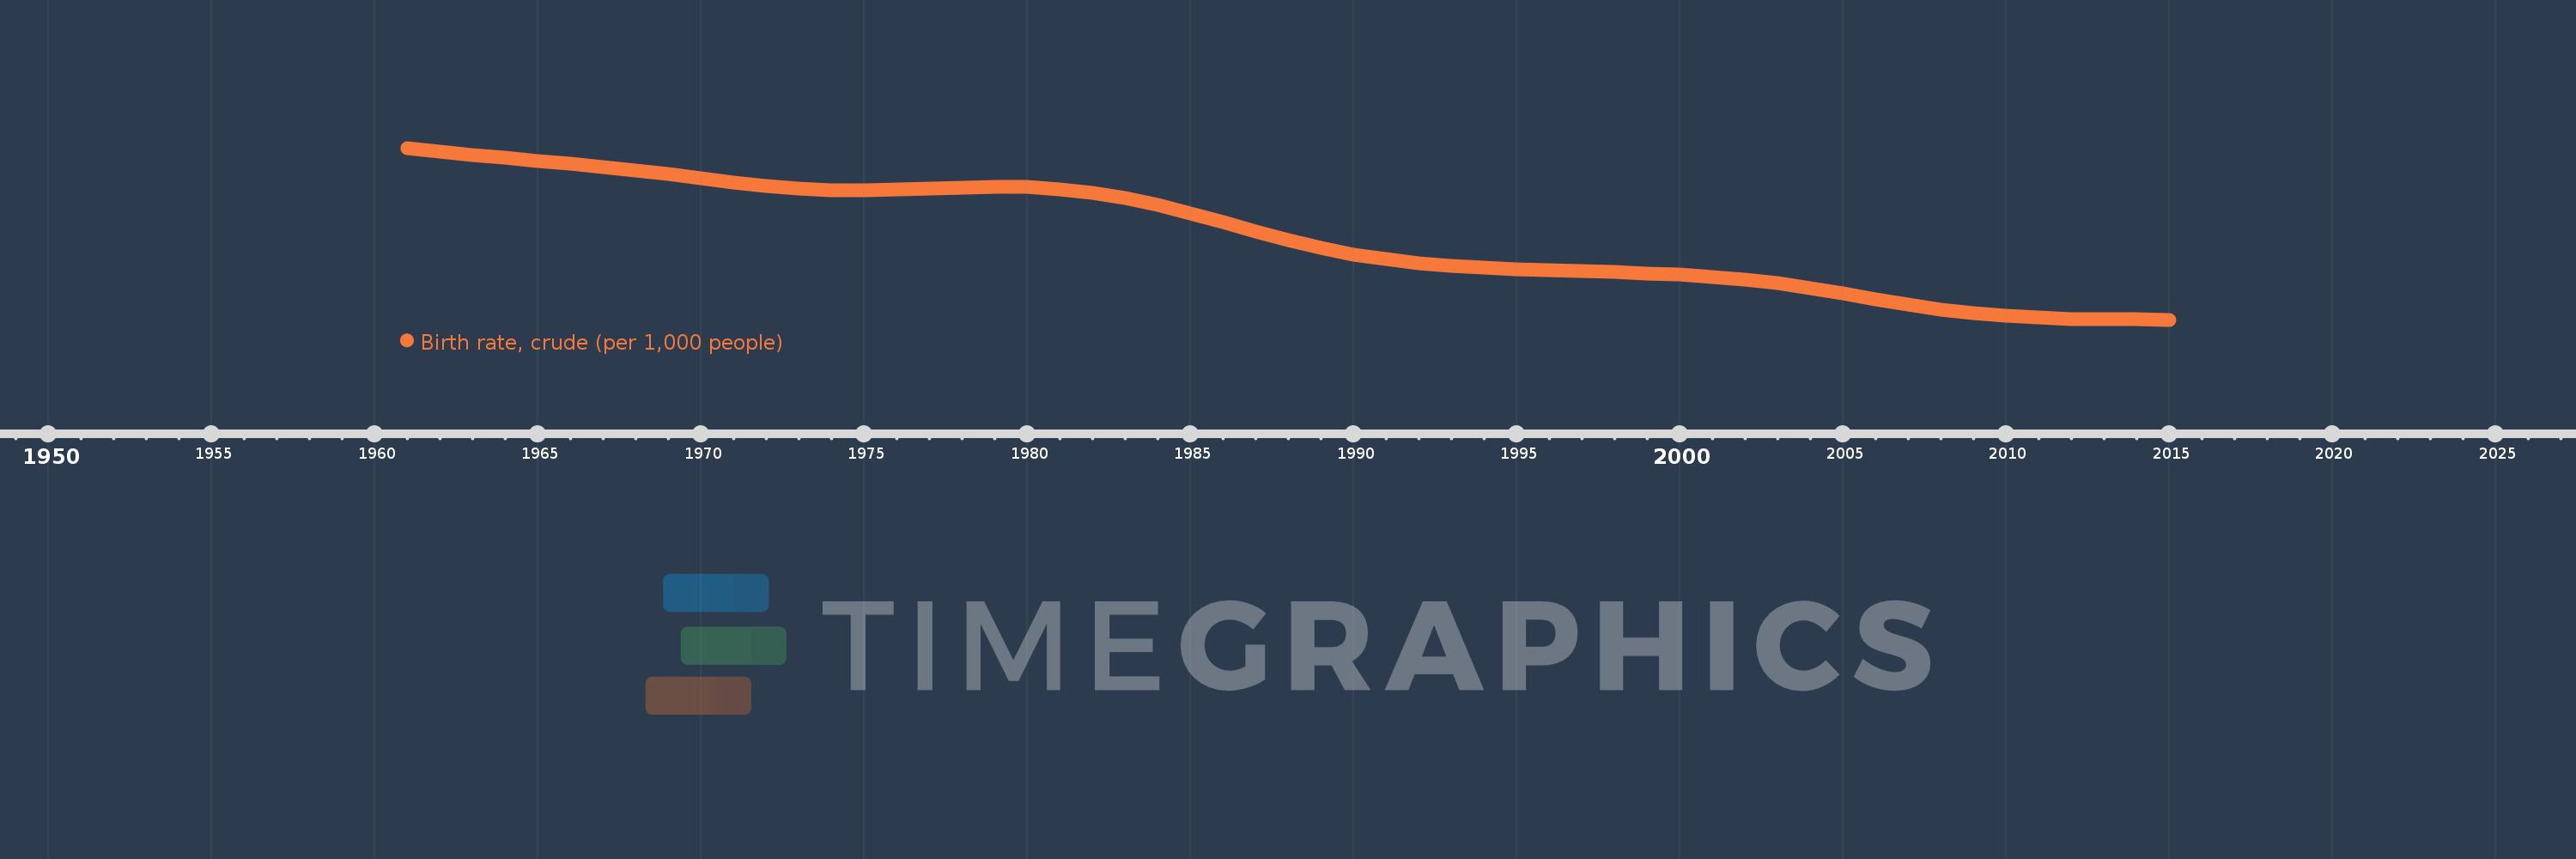
Birth rate, crude (per 1,000 people)
2015,2014,2013,2012,2011,2010,2009,2008,2007,2006,2005,2004,2003,2002,2001,2000,1999,1998,1997,1996,1995,1994,1993,1992,1991,1990,1989,1988,1987,1986,1985,1984,1983,1982,1981,1980,1979,1978,1977,1976,1975,1974,1973,1972,1971,1970,1969,1968,1967,1966,1965,1964,1963,1962,1961
This statistics in other country:
AfghanistanAlbaniaAlgeriaAmerican SamoaAndorraAngolaAntigua and BarbudaArab WorldArgentinaArmeniaArubaAustraliaAustriaAzerbaijanBahamas, TheBahrainBangladeshBarbadosBelarusBelgiumBelizeBeninBermudaBhutanBoliviaBosnia and HerzegovinaBotswanaBrazilBrunei DarussalamBulgariaBurkina FasoBurundiCabo VerdeCambodiaCameroonCanadaCaribbean small statesCayman IslandsCentral African RepublicCentral Europe and the BalticsChadChannel IslandsChileChinaColombiaComorosCongo, Dem. Rep.Congo, Rep.Costa RicaCote d'IvoireCroatiaCubaCuracaoCyprusCzech RepublicDenmarkDjiboutiDominicaDominican RepublicEarly-demographic dividendEast Asia & PacificEast Asia & Pacific (excluding high income)East Asia & Pacific (IDA & IBRD countries)EcuadorEgypt, Arab Rep.El SalvadorEquatorial GuineaEritreaEstoniaEthiopiaEuro areaEurope & Central AsiaEurope & Central Asia (excluding high income)Europe & Central Asia (IDA & IBRD countries)European UnionFaroe IslandsFijiFinlandFragile and conflict affected situationsFranceFrench PolynesiaGabonGambia, TheGeorgiaGermanyGhanaGreeceGreenlandGrenadaGuamGuatemalaGuineaGuinea-BissauGuyanaHaitiHeavily indebted poor countries (HIPC)High incomeHondurasHong Kong SAR, ChinaHungaryIBRD onlyIcelandIDA & IBRD totalIDA blendIDA onlyIDA totalIndiaIndonesiaIran, Islamic Rep.IraqIrelandIsle of ManIsraelItalyJamaicaJapanJordanKazakhstanKenyaKiribatiKorea, Dem. People’s Rep.Korea, Rep.KosovoKuwaitKyrgyz RepublicLao PDRLate-demographic dividendLatin America & Caribbean Latin America & Caribbean (excluding high income)Latin America & the Caribbean (IDA & IBRD countries)LatviaLeast developed countries: UN classificationLebanonLesothoLiberiaLibyaLiechtensteinLithuaniaLow & middle incomeLow incomeLower middle incomeLuxembourgMacao SAR, ChinaMacedonia, FYRMadagascarMalawiMalaysiaMaldivesMaliMaltaMarshall IslandsMauritaniaMauritiusMexicoMicronesia, Fed. Sts.Middle East & North AfricaMiddle East & North Africa (excluding high income)Middle East & North Africa (IDA & IBRD countries)Middle incomeMoldovaMonacoMongoliaMontenegroMoroccoMozambiqueMyanmarNamibiaNepalNetherlandsNew CaledoniaNew ZealandNicaraguaNigerNigeriaNorth AmericaNorwayOECD membersOmanOther small statesPacific island small statesPakistanPalauPanamaPapua New GuineaParaguayPeruPhilippinesPolandPortugalPost-demographic dividendPre-demographic dividendPuerto RicoQatarRomaniaRussian FederationRwandaSamoaSan MarinoSao Tome and PrincipeSaudi ArabiaSenegalSerbiaSeychellesSierra LeoneSingaporeSint Maarten (Dutch part)Slovak RepublicSloveniaSmall statesSolomon IslandsSomaliaSouth AfricaSouth AsiaSouth Asia (IDA & IBRD)South SudanSpainSri LankaSt. Kitts and NevisSt. LuciaSt. Martin (French part)St. Vincent and the GrenadinesSub-Saharan Africa Sub-Saharan Africa (excluding high income)Sub-Saharan Africa (IDA & IBRD countries)SudanSurinameSwazilandSwedenSwitzerlandSyrian Arab RepublicTajikistanTanzaniaThailandTimor-LesteTogoTongaTrinidad and TobagoTunisiaTurkeyTurkmenistanUgandaUkraineUnited Arab EmiratesUnited KingdomUnited StatesUpper middle incomeUruguayUzbekistanVanuatuVenezuela, RBVietnamVirgin Islands (U.S.)West Bank and GazaWorldYemen, Rep.ZambiaZimbabwe Timeline:
This timeline shows a graph from 1961 to 2015 of Qatar. No data until 1960. Number of actual observations by date: 55.
Source name:
World Development Indicators
Source organization:
(1) United Nations Population Division. World Population Prospects, (2) Census reports and other statistical publications from national statistical offices, (3) Eurostat: Demographic Statistics, (4) United Nations Statistical Division. Population and Vital Statistics Reprot (various years), (5) U.S. Census Bureau: International Database, and (6) Secretariat of the Pacific Community: Statistics and Demography Programme.
Categories, topics:
Health
Last updated:
apr 23, 2017
Indicators value changes by year
Minimum:
11.886
jan 1, 2015
Maximum:
42.436
jan 1, 1961
At the date of observation
Value
Absolute change
Change from previous value
jan 1, 1961
42.436
+42.436
0.0%
jan 1, 1962
41.796
-0.64
-1.51%
jan 1, 1963
41.2
-0.596
-1.43%
jan 1, 1964
40.649
-0.551
-1.34%
jan 1, 1965
40.136
-0.513
-1.26%
jan 1, 1966
39.624
-0.512
-1.28%
jan 1, 1967
39.065
-0.559
-1.41%
jan 1, 1968
38.435
-0.63
-1.61%
jan 1, 1969
37.733
-0.702
-1.83%
jan 1, 1970
36.982
-0.751
-1.99%
jan 1, 1971
36.253
-0.729
-1.97%
jan 1, 1972
35.635
-0.618
-1.7%
jan 1, 1973
35.194
-0.441
-1.24%
jan 1, 1974
34.957
-0.237
-0.67%
jan 1, 1975
34.913
-0.044
-0.13%
jan 1, 1976
35.025
+0.112
0.32%
jan 1, 1977
35.233
+0.208
0.59%
jan 1, 1978
35.434
+0.201
0.57%
jan 1, 1979
35.531
+0.097
0.27%
jan 1, 1980
35.456
-0.075
-0.21%
jan 1, 1981
35.124
-0.332
-0.94%
jan 1, 1982
34.461
-0.663
-1.89%
jan 1, 1983
33.484
-0.977
-2.84%
jan 1, 1984
32.238
-1.246
-3.72%
jan 1, 1985
30.774
-1.464
-4.54%
jan 1, 1986
29.179
-1.595
-5.18%
jan 1, 1987
27.559
-1.62
-5.55%
jan 1, 1988
26.021
-1.538
-5.58%
jan 1, 1989
24.653
-1.368
-5.26%
jan 1, 1990
23.508
-1.145
-4.64%
jan 1, 1991
22.617
-0.891
-3.79%
jan 1, 1992
21.975
-0.642
-2.84%
jan 1, 1993
21.514
-0.461
-2.1%
jan 1, 1994
21.168
-0.346
-1.61%
jan 1, 1995
20.901
-0.267
-1.26%
jan 1, 1996
20.686
-0.215
-1.03%
jan 1, 1997
20.501
-0.185
-0.89%
jan 1, 1998
20.328
-0.173
-0.84%
jan 1, 1999
20.138
-0.19
-0.93%
jan 1, 2000
19.895
-0.243
-1.21%
jan 1, 2001
19.543
-0.352
-1.77%
jan 1, 2002
19.027
-0.516
-2.64%
jan 1, 2003
18.341
-0.686
-3.61%
jan 1, 2004
17.506
-0.835
-4.55%
jan 1, 2005
16.553
-0.953
-5.44%
jan 1, 2006
15.55
-1.003
-6.06%
jan 1, 2007
14.581
-0.969
-6.23%
jan 1, 2008
13.725
-0.856
-5.87%
jan 1, 2009
13.036
-0.689
-5.02%
jan 1, 2010
12.536
-0.5
-3.84%
jan 1, 2011
12.223
-0.313
-2.5%
jan 1, 2012
12.063
-0.16
-1.31%
jan 1, 2013
11.989
-0.074
-0.61%
jan 1, 2014
11.94
-0.049
-0.41%
jan 1, 2015
11.886
-0.054
-0.45%
Ranking of countries by current statistics by years


Comments: