29
/
en
AIzaSyAYiBZKx7MnpbEhh9jyipgxe19OcubqV5w
April 1, 2024
162245
Jamaica
JAM
true
2
1
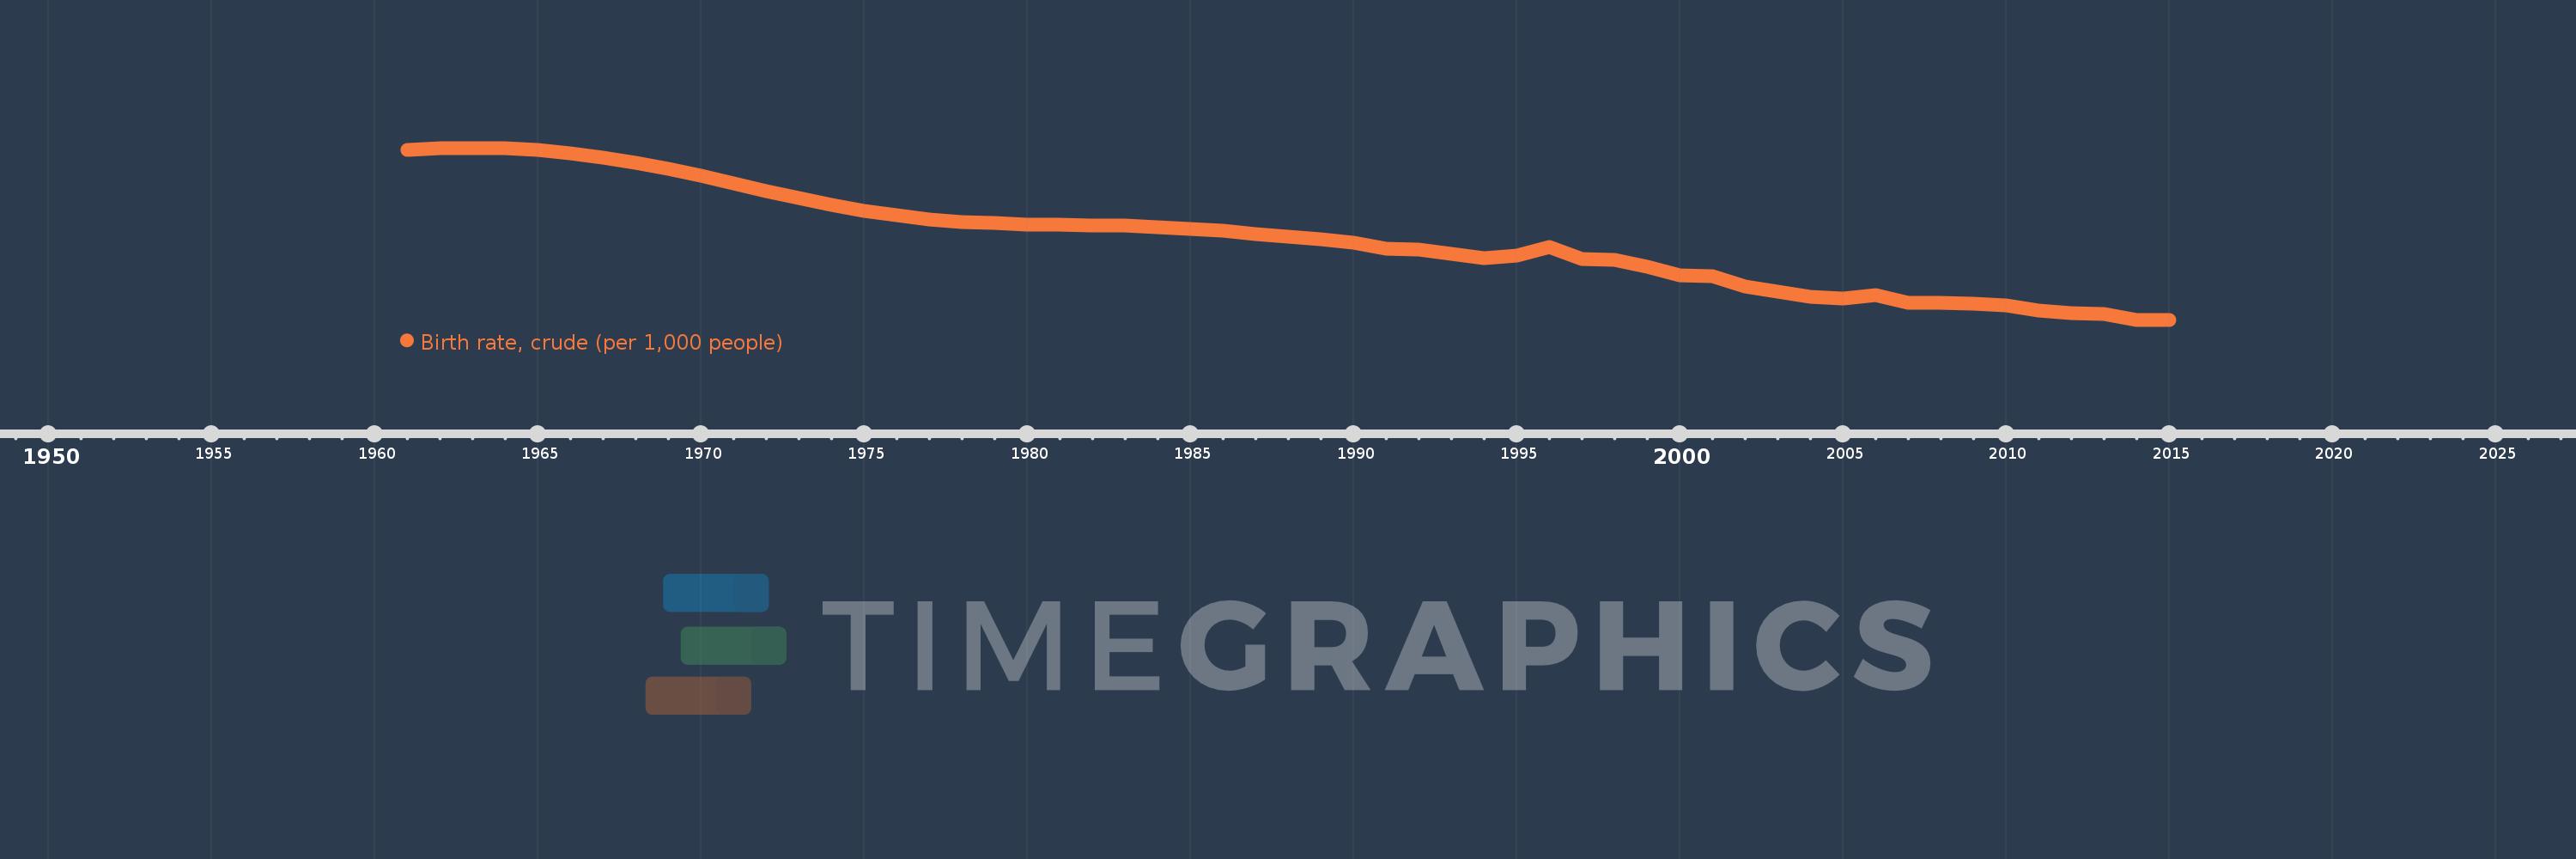
Birth rate, crude (per 1,000 people)
2015,2014,2013,2012,2011,2010,2009,2008,2007,2006,2005,2004,2003,2002,2001,2000,1999,1998,1997,1996,1995,1994,1993,1992,1991,1990,1989,1988,1987,1986,1985,1984,1983,1982,1981,1980,1979,1978,1977,1976,1975,1974,1973,1972,1971,1970,1969,1968,1967,1966,1965,1964,1963,1962,1961
This statistics in other country:
AfghanistanAlbaniaAlgeriaAmerican SamoaAndorraAngolaAntigua and BarbudaArab WorldArgentinaArmeniaArubaAustraliaAustriaAzerbaijanBahamas, TheBahrainBangladeshBarbadosBelarusBelgiumBelizeBeninBermudaBhutanBoliviaBosnia and HerzegovinaBotswanaBrazilBrunei DarussalamBulgariaBurkina FasoBurundiCabo VerdeCambodiaCameroonCanadaCaribbean small statesCayman IslandsCentral African RepublicCentral Europe and the BalticsChadChannel IslandsChileChinaColombiaComorosCongo, Dem. Rep.Congo, Rep.Costa RicaCote d'IvoireCroatiaCubaCuracaoCyprusCzech RepublicDenmarkDjiboutiDominicaDominican RepublicEarly-demographic dividendEast Asia & PacificEast Asia & Pacific (excluding high income)East Asia & Pacific (IDA & IBRD countries)EcuadorEgypt, Arab Rep.El SalvadorEquatorial GuineaEritreaEstoniaEthiopiaEuro areaEurope & Central AsiaEurope & Central Asia (excluding high income)Europe & Central Asia (IDA & IBRD countries)European UnionFaroe IslandsFijiFinlandFragile and conflict affected situationsFranceFrench PolynesiaGabonGambia, TheGeorgiaGermanyGhanaGreeceGreenlandGrenadaGuamGuatemalaGuineaGuinea-BissauGuyanaHaitiHeavily indebted poor countries (HIPC)High incomeHondurasHong Kong SAR, ChinaHungaryIBRD onlyIcelandIDA & IBRD totalIDA blendIDA onlyIDA totalIndiaIndonesiaIran, Islamic Rep.IraqIrelandIsle of ManIsraelItalyJamaicaJapanJordanKazakhstanKenyaKiribatiKorea, Dem. People’s Rep.Korea, Rep.KosovoKuwaitKyrgyz RepublicLao PDRLate-demographic dividendLatin America & Caribbean Latin America & Caribbean (excluding high income)Latin America & the Caribbean (IDA & IBRD countries)LatviaLeast developed countries: UN classificationLebanonLesothoLiberiaLibyaLiechtensteinLithuaniaLow & middle incomeLow incomeLower middle incomeLuxembourgMacao SAR, ChinaMacedonia, FYRMadagascarMalawiMalaysiaMaldivesMaliMaltaMarshall IslandsMauritaniaMauritiusMexicoMicronesia, Fed. Sts.Middle East & North AfricaMiddle East & North Africa (excluding high income)Middle East & North Africa (IDA & IBRD countries)Middle incomeMoldovaMonacoMongoliaMontenegroMoroccoMozambiqueMyanmarNamibiaNepalNetherlandsNew CaledoniaNew ZealandNicaraguaNigerNigeriaNorth AmericaNorwayOECD membersOmanOther small statesPacific island small statesPakistanPalauPanamaPapua New GuineaParaguayPeruPhilippinesPolandPortugalPost-demographic dividendPre-demographic dividendPuerto RicoQatarRomaniaRussian FederationRwandaSamoaSan MarinoSao Tome and PrincipeSaudi ArabiaSenegalSerbiaSeychellesSierra LeoneSingaporeSint Maarten (Dutch part)Slovak RepublicSloveniaSmall statesSolomon IslandsSomaliaSouth AfricaSouth AsiaSouth Asia (IDA & IBRD)South SudanSpainSri LankaSt. Kitts and NevisSt. LuciaSt. Martin (French part)St. Vincent and the GrenadinesSub-Saharan Africa Sub-Saharan Africa (excluding high income)Sub-Saharan Africa (IDA & IBRD countries)SudanSurinameSwazilandSwedenSwitzerlandSyrian Arab RepublicTajikistanTanzaniaThailandTimor-LesteTogoTongaTrinidad and TobagoTunisiaTurkeyTurkmenistanUgandaUkraineUnited Arab EmiratesUnited KingdomUnited StatesUpper middle incomeUruguayUzbekistanVanuatuVenezuela, RBVietnamVirgin Islands (U.S.)West Bank and GazaWorldYemen, Rep.ZambiaZimbabwe Timeline:
This timeline shows a graph from 1961 to 2015 of Jamaica. No data until 1960. Number of actual observations by date: 55.
Source name:
World Development Indicators
Source organization:
(1) United Nations Population Division. World Population Prospects, (2) Census reports and other statistical publications from national statistical offices, (3) Eurostat: Demographic Statistics, (4) United Nations Statistical Division. Population and Vital Statistics Reprot (various years), (5) U.S. Census Bureau: International Database, and (6) Secretariat of the Pacific Community: Statistics and Demography Programme.
Categories, topics:
Health
Last updated:
apr 23, 2017
Indicators value changes by year
Maximum:
41.681
jan 1, 1963
At the date of observation
Value
Absolute change
Change from previous value
jan 1, 1961
41.316
+41.316
0.0%
jan 1, 1962
41.587
+0.271
0.66%
jan 1, 1963
41.681
+0.094
0.23%
jan 1, 1964
41.589
-0.092
-0.22%
jan 1, 1965
41.311
-0.278
-0.67%
jan 1, 1966
40.833
-0.478
-1.16%
jan 1, 1967
40.143
-0.69
-1.69%
jan 1, 1968
39.259
-0.884
-2.2%
jan 1, 1969
38.22
-1.039
-2.65%
jan 1, 1970
37.07
-1.15
-3.01%
jan 1, 1971
35.862
-1.208
-3.26%
jan 1, 1972
34.644
-1.218
-3.4%
jan 1, 1973
33.465
-1.179
-3.4%
jan 1, 1974
32.371
-1.094
-3.27%
jan 1, 1975
31.403
-0.968
-2.99%
jan 1, 1976
30.606
-0.797
-2.54%
jan 1, 1977
30.01
-0.596
-1.95%
jan 1, 1978
29.595
-0.415
-1.38%
jan 1, 1979
29.328
-0.267
-0.9%
jan 1, 1980
29.179
-0.149
-0.51%
jan 1, 1981
29.098
-0.081
-0.28%
jan 1, 1982
29.028
-0.07
-0.24%
jan 1, 1983
28.917
-0.111
-0.38%
jan 1, 1984
28.728
-0.189
-0.65%
jan 1, 1985
28.444
-0.284
-0.99%
jan 1, 1986
28.066
-0.378
-1.33%
jan 1, 1987
27.617
-0.449
-1.6%
jan 1, 1988
27.14
-0.477
-1.73%
jan 1, 1989
26.673
-0.467
-1.72%
jan 1, 1990
26.229
-0.444
-1.66%
jan 1, 1991
25.2
-1.029
-3.92%
jan 1, 1992
25.1
-0.1
-0.4%
jan 1, 1993
24.3
-0.8
-3.19%
jan 1, 1994
23.6
-0.7
-2.88%
jan 1, 1995
24.1
+0.5
2.12%
jan 1, 1996
25.5
+1.4
5.81%
jan 1, 1997
23.5
-2.0
-7.84%
jan 1, 1998
23.4
-0.1
-0.43%
jan 1, 1999
22.2
-1.2
-5.13%
jan 1, 2000
20.8
-1.4
-6.31%
jan 1, 2001
20.7
-0.1
-0.48%
jan 1, 2002
18.92
-1.78
-8.6%
jan 1, 2003
18.15
-0.77
-4.07%
jan 1, 2004
17.36
-0.79
-4.35%
jan 1, 2005
17.02
-0.34
-1.96%
jan 1, 2006
17.54
+0.52
3.06%
jan 1, 2007
16.3
-1.24
-7.07%
jan 1, 2008
16.29
-0.01
-0.06%
jan 1, 2009
16.14
-0.15
-0.92%
jan 1, 2010
15.96
-0.18
-1.12%
jan 1, 2011
15.05
-0.91
-5.7%
jan 1, 2012
14.69
-0.36
-2.39%
jan 1, 2013
14.53
-0.16
-1.09%
jan 1, 2014
13.54
-0.99
-6.81%
jan 1, 2015
13.54
0.0
0.0%
Ranking of countries by current statistics by years


Comments: