29
/
en
AIzaSyAYiBZKx7MnpbEhh9jyipgxe19OcubqV5w
April 1, 2024
28901
East Asia & Pacific (IDA & IBRD countries)
TEA
false
2
1
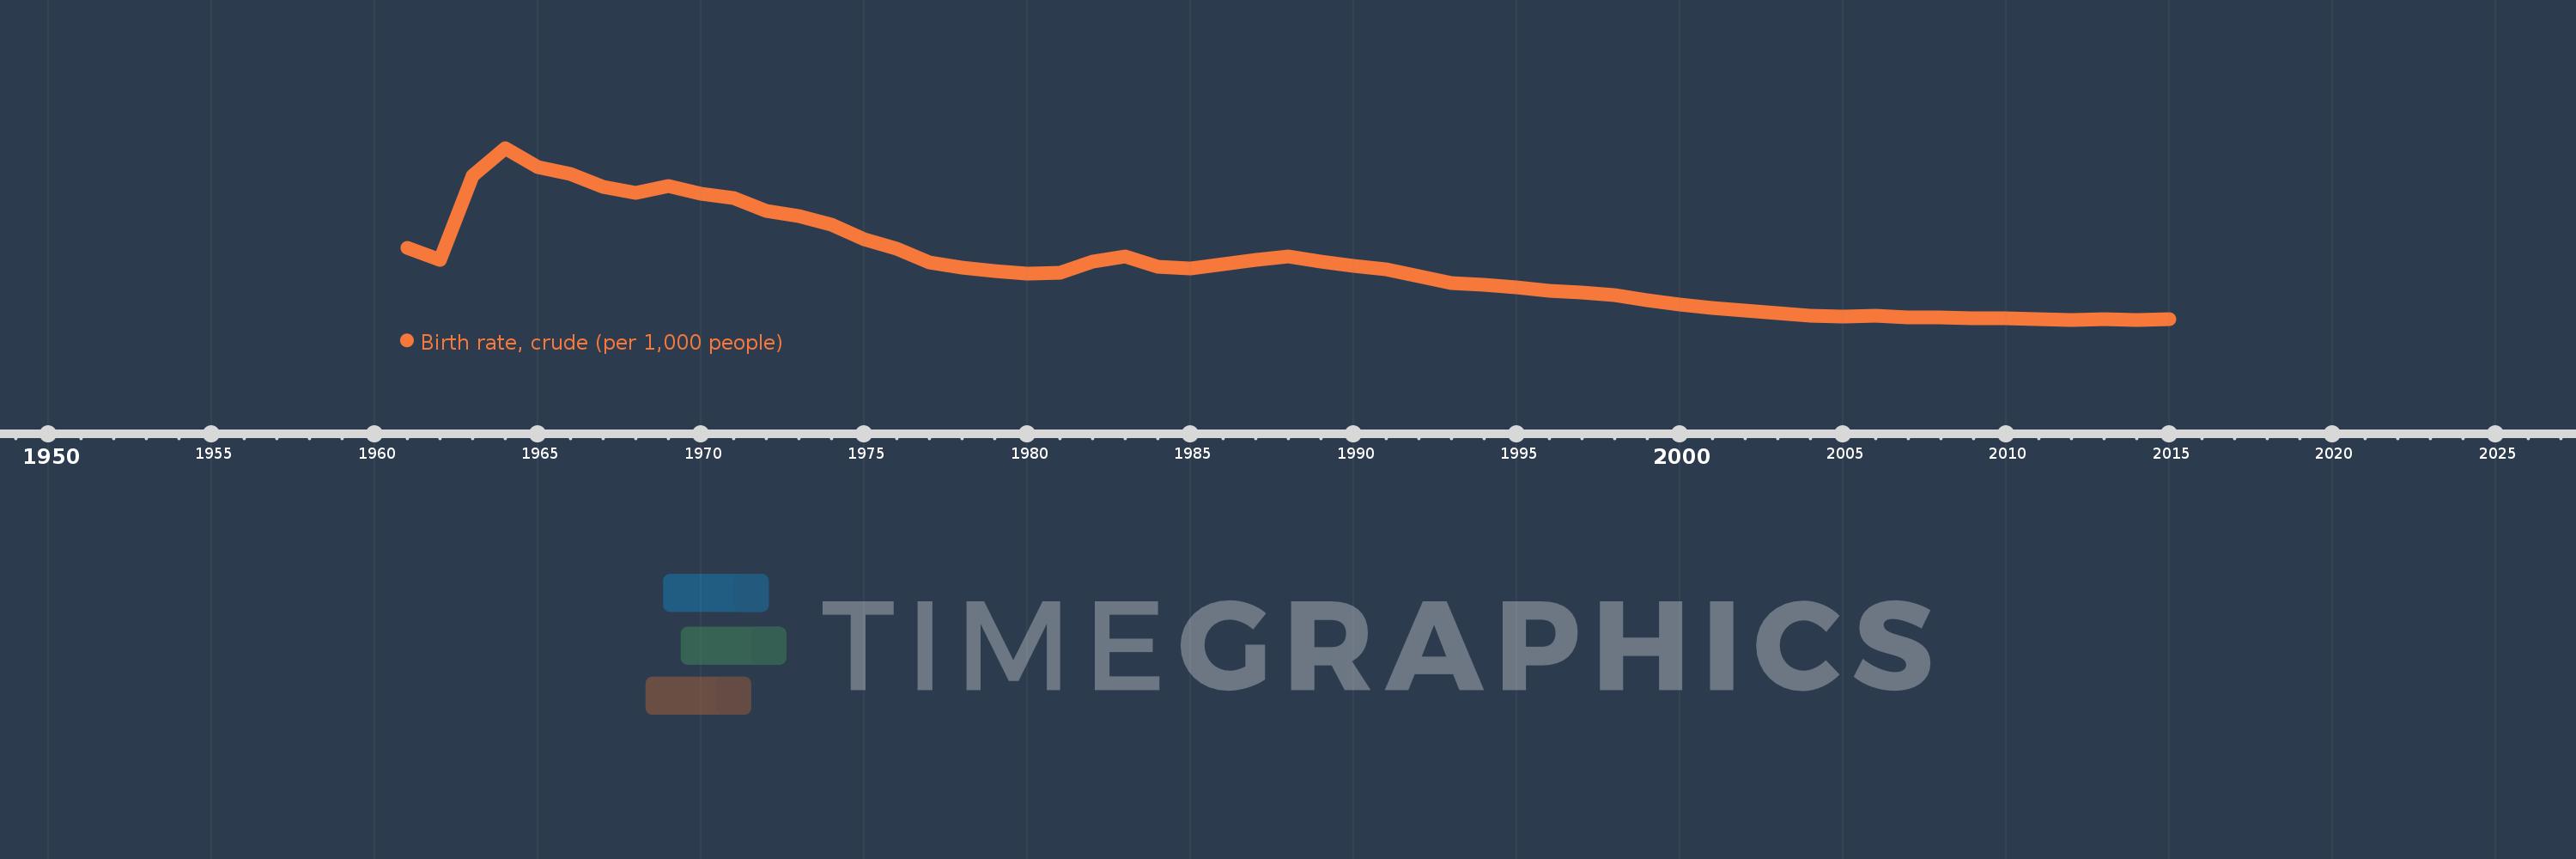
Birth rate, crude (per 1,000 people)
2015,2014,2013,2012,2011,2010,2009,2008,2007,2006,2005,2004,2003,2002,2001,2000,1999,1998,1997,1996,1995,1994,1993,1992,1991,1990,1989,1988,1987,1986,1985,1984,1983,1982,1981,1980,1979,1978,1977,1976,1975,1974,1973,1972,1971,1970,1969,1968,1967,1966,1965,1964,1963,1962,1961
This statistics in other country:
AfghanistanAlbaniaAlgeriaAmerican SamoaAndorraAngolaAntigua and BarbudaArab WorldArgentinaArmeniaArubaAustraliaAustriaAzerbaijanBahamas, TheBahrainBangladeshBarbadosBelarusBelgiumBelizeBeninBermudaBhutanBoliviaBosnia and HerzegovinaBotswanaBrazilBrunei DarussalamBulgariaBurkina FasoBurundiCabo VerdeCambodiaCameroonCanadaCaribbean small statesCayman IslandsCentral African RepublicCentral Europe and the BalticsChadChannel IslandsChileChinaColombiaComorosCongo, Dem. Rep.Congo, Rep.Costa RicaCote d'IvoireCroatiaCubaCuracaoCyprusCzech RepublicDenmarkDjiboutiDominicaDominican RepublicEarly-demographic dividendEast Asia & PacificEast Asia & Pacific (excluding high income)East Asia & Pacific (IDA & IBRD countries)EcuadorEgypt, Arab Rep.El SalvadorEquatorial GuineaEritreaEstoniaEthiopiaEuro areaEurope & Central AsiaEurope & Central Asia (excluding high income)Europe & Central Asia (IDA & IBRD countries)European UnionFaroe IslandsFijiFinlandFragile and conflict affected situationsFranceFrench PolynesiaGabonGambia, TheGeorgiaGermanyGhanaGreeceGreenlandGrenadaGuamGuatemalaGuineaGuinea-BissauGuyanaHaitiHeavily indebted poor countries (HIPC)High incomeHondurasHong Kong SAR, ChinaHungaryIBRD onlyIcelandIDA & IBRD totalIDA blendIDA onlyIDA totalIndiaIndonesiaIran, Islamic Rep.IraqIrelandIsle of ManIsraelItalyJamaicaJapanJordanKazakhstanKenyaKiribatiKorea, Dem. People’s Rep.Korea, Rep.KosovoKuwaitKyrgyz RepublicLao PDRLate-demographic dividendLatin America & Caribbean Latin America & Caribbean (excluding high income)Latin America & the Caribbean (IDA & IBRD countries)LatviaLeast developed countries: UN classificationLebanonLesothoLiberiaLibyaLiechtensteinLithuaniaLow & middle incomeLow incomeLower middle incomeLuxembourgMacao SAR, ChinaMacedonia, FYRMadagascarMalawiMalaysiaMaldivesMaliMaltaMarshall IslandsMauritaniaMauritiusMexicoMicronesia, Fed. Sts.Middle East & North AfricaMiddle East & North Africa (excluding high income)Middle East & North Africa (IDA & IBRD countries)Middle incomeMoldovaMonacoMongoliaMontenegroMoroccoMozambiqueMyanmarNamibiaNepalNetherlandsNew CaledoniaNew ZealandNicaraguaNigerNigeriaNorth AmericaNorwayOECD membersOmanOther small statesPacific island small statesPakistanPalauPanamaPapua New GuineaParaguayPeruPhilippinesPolandPortugalPost-demographic dividendPre-demographic dividendPuerto RicoQatarRomaniaRussian FederationRwandaSamoaSan MarinoSao Tome and PrincipeSaudi ArabiaSenegalSerbiaSeychellesSierra LeoneSingaporeSint Maarten (Dutch part)Slovak RepublicSloveniaSmall statesSolomon IslandsSomaliaSouth AfricaSouth AsiaSouth Asia (IDA & IBRD)South SudanSpainSri LankaSt. Kitts and NevisSt. LuciaSt. Martin (French part)St. Vincent and the GrenadinesSub-Saharan Africa Sub-Saharan Africa (excluding high income)Sub-Saharan Africa (IDA & IBRD countries)SudanSurinameSwazilandSwedenSwitzerlandSyrian Arab RepublicTajikistanTanzaniaThailandTimor-LesteTogoTongaTrinidad and TobagoTunisiaTurkeyTurkmenistanUgandaUkraineUnited Arab EmiratesUnited KingdomUnited StatesUpper middle incomeUruguayUzbekistanVanuatuVenezuela, RBVietnamVirgin Islands (U.S.)West Bank and GazaWorldYemen, Rep.ZambiaZimbabwe Timeline:
This timeline shows a graph from 1961 to 2015 of East Asia & Pacific (IDA & IBRD countries). No data until 1960. Number of actual observations by date: 55.
Source name:
World Development Indicators
Source organization:
(1) United Nations Population Division. World Population Prospects, (2) Census reports and other statistical publications from national statistical offices, (3) Eurostat: Demographic Statistics, (4) United Nations Statistical Division. Population and Vital Statistics Reprot (various years), (5) U.S. Census Bureau: International Database, and (6) Secretariat of the Pacific Community: Statistics and Demography Programme.
Categories, topics:
Health
Last updated:
apr 23, 2017
Indicators value changes by year
Minimum:
14.386
jan 1, 2014
Maximum:
43.165
jan 1, 1964
At the date of observation
Value
Absolute change
Change from previous value
jan 1, 1961
26.494
+26.494
0.0%
jan 1, 1962
24.442
-2.052
-7.75%
jan 1, 1963
38.547
+14.105
57.71%
jan 1, 1964
43.165
+4.618
11.98%
jan 1, 1965
39.906
-3.259
-7.55%
jan 1, 1966
38.849
-1.056
-2.65%
jan 1, 1967
36.619
-2.23
-5.74%
jan 1, 1968
35.676
-0.943
-2.58%
jan 1, 1969
36.745
+1.069
3.0%
jan 1, 1970
35.498
-1.247
-3.39%
jan 1, 1971
34.841
-0.658
-1.85%
jan 1, 1972
32.619
-2.222
-6.38%
jan 1, 1973
31.81
-0.809
-2.48%
jan 1, 1974
30.289
-1.52
-4.78%
jan 1, 1975
27.833
-2.457
-8.11%
jan 1, 1976
26.352
-1.48
-5.32%
jan 1, 1977
23.933
-2.419
-9.18%
jan 1, 1978
23.095
-0.838
-3.5%
jan 1, 1979
22.485
-0.61
-2.64%
jan 1, 1980
22.063
-0.422
-1.88%
jan 1, 1981
22.245
+0.182
0.83%
jan 1, 1982
24.105
+1.86
8.36%
jan 1, 1983
24.975
+0.87
3.61%
jan 1, 1984
23.318
-1.657
-6.63%
jan 1, 1985
22.963
-0.355
-1.52%
jan 1, 1986
23.63
+0.667
2.9%
jan 1, 1987
24.465
+0.835
3.53%
jan 1, 1988
24.941
+0.476
1.95%
jan 1, 1989
24.081
-0.86
-3.45%
jan 1, 1990
23.35
-0.73
-3.03%
jan 1, 1991
22.818
-0.533
-2.28%
jan 1, 1992
21.67
-1.148
-5.03%
jan 1, 1993
20.5
-1.17
-5.4%
jan 1, 1994
20.207
-0.294
-1.43%
jan 1, 1995
19.76
-0.447
-2.21%
jan 1, 1996
19.18
-0.58
-2.93%
jan 1, 1997
18.923
-0.257
-1.34%
jan 1, 1998
18.489
-0.434
-2.29%
jan 1, 1999
17.708
-0.781
-4.23%
jan 1, 2000
16.901
-0.806
-4.55%
jan 1, 2001
16.391
-0.51
-3.02%
jan 1, 2002
15.872
-0.519
-3.16%
jan 1, 2003
15.457
-0.415
-2.61%
jan 1, 2004
15.098
-0.36
-2.33%
jan 1, 2005
14.971
-0.127
-0.84%
jan 1, 2006
15.003
+0.033
0.22%
jan 1, 2007
14.742
-0.261
-1.74%
jan 1, 2008
14.705
-0.037
-0.25%
jan 1, 2009
14.689
-0.016
-0.11%
jan 1, 2010
14.639
-0.05
-0.34%
jan 1, 2011
14.435
-0.205
-1.4%
jan 1, 2012
14.406
-0.029
-0.2%
jan 1, 2013
14.465
+0.059
0.41%
jan 1, 2014
14.386
-0.078
-0.54%
jan 1, 2015
14.533
+0.147
1.02%
Ranking of countries by current statistics by years


Comments: