29
/
en
AIzaSyAYiBZKx7MnpbEhh9jyipgxe19OcubqV5w
April 1, 2024
168454
Kiribati
KIR
true
2
1
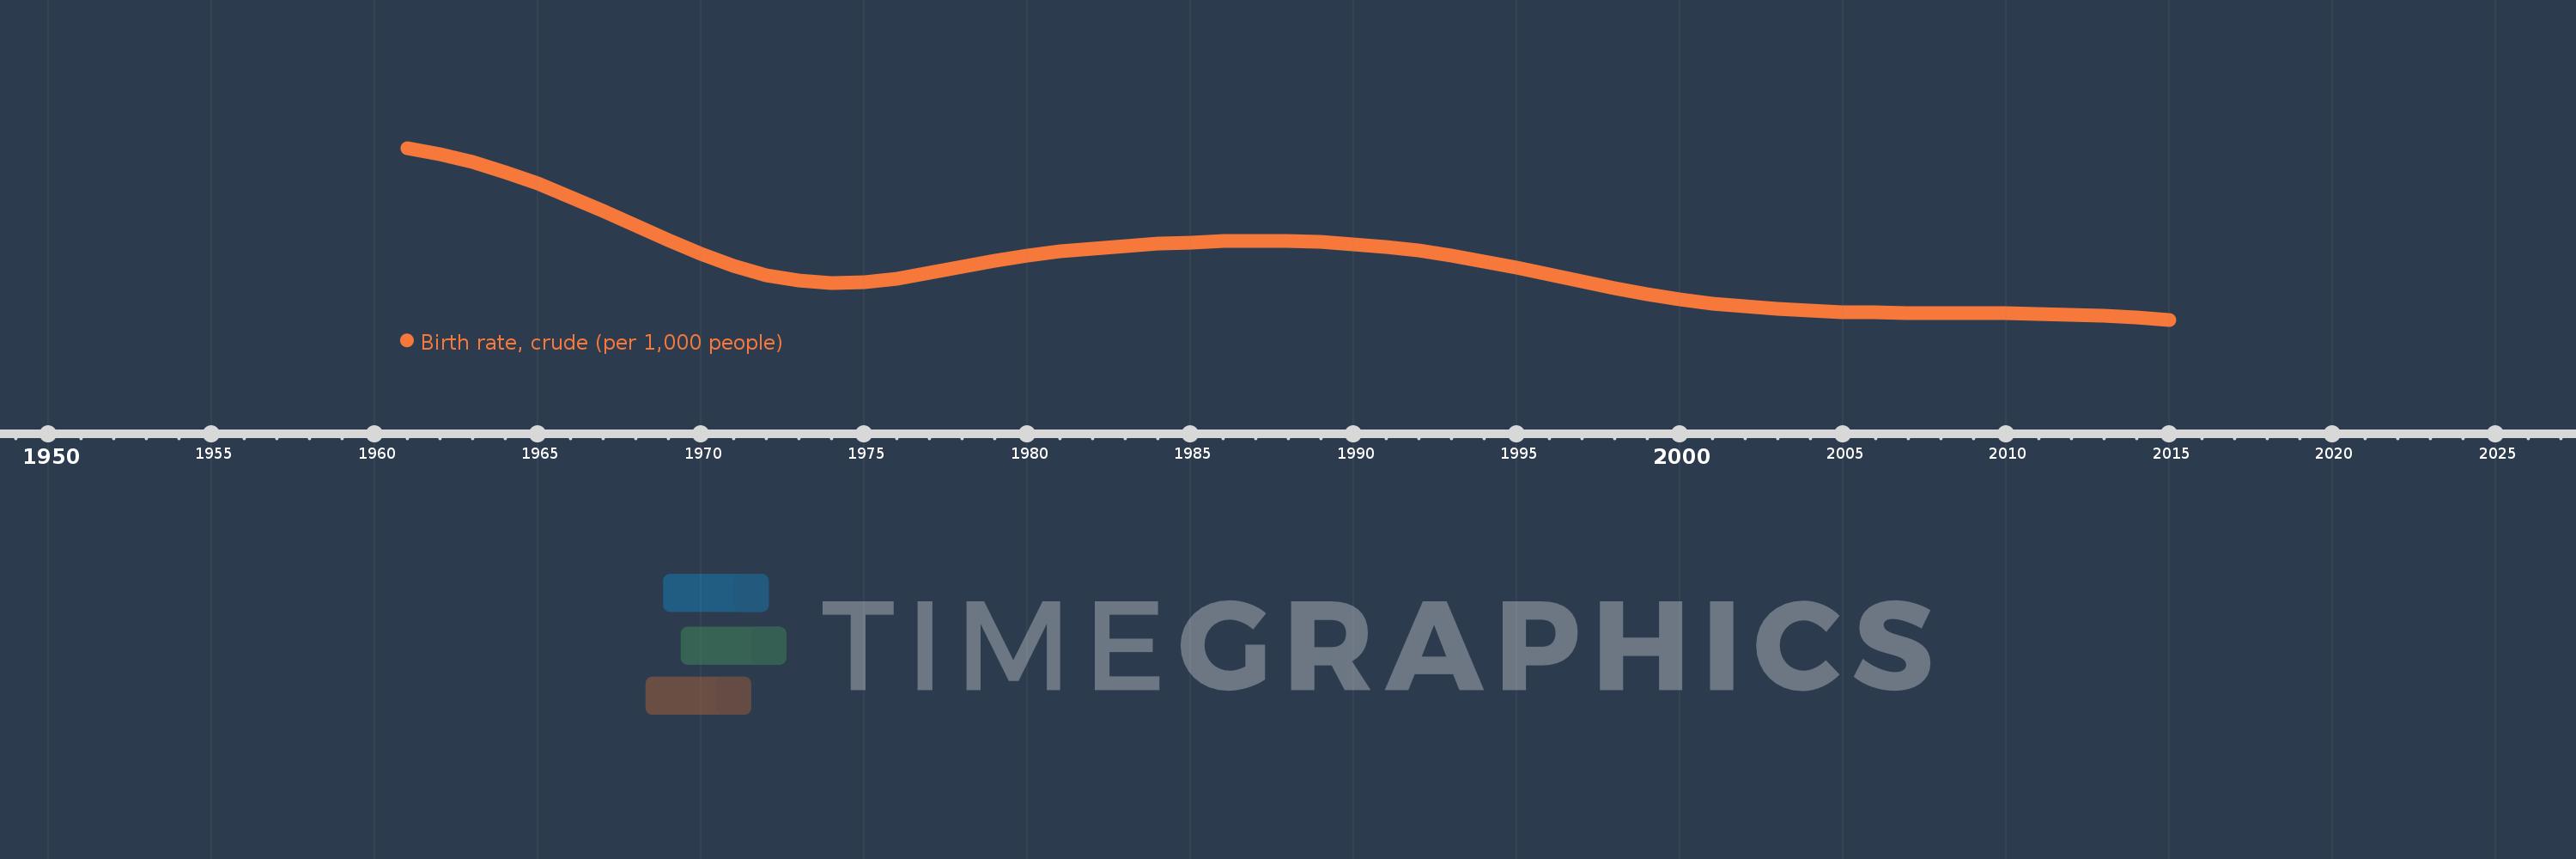
Birth rate, crude (per 1,000 people)
2015,2014,2013,2012,2011,2010,2009,2008,2007,2006,2005,2004,2003,2002,2001,2000,1999,1998,1997,1996,1995,1994,1993,1992,1991,1990,1989,1988,1987,1986,1985,1984,1983,1982,1981,1980,1979,1978,1977,1976,1975,1974,1973,1972,1971,1970,1969,1968,1967,1966,1965,1964,1963,1962,1961
This statistics in other country:
AfghanistanAlbaniaAlgeriaAmerican SamoaAndorraAngolaAntigua and BarbudaArab WorldArgentinaArmeniaArubaAustraliaAustriaAzerbaijanBahamas, TheBahrainBangladeshBarbadosBelarusBelgiumBelizeBeninBermudaBhutanBoliviaBosnia and HerzegovinaBotswanaBrazilBrunei DarussalamBulgariaBurkina FasoBurundiCabo VerdeCambodiaCameroonCanadaCaribbean small statesCayman IslandsCentral African RepublicCentral Europe and the BalticsChadChannel IslandsChileChinaColombiaComorosCongo, Dem. Rep.Congo, Rep.Costa RicaCote d'IvoireCroatiaCubaCuracaoCyprusCzech RepublicDenmarkDjiboutiDominicaDominican RepublicEarly-demographic dividendEast Asia & PacificEast Asia & Pacific (excluding high income)East Asia & Pacific (IDA & IBRD countries)EcuadorEgypt, Arab Rep.El SalvadorEquatorial GuineaEritreaEstoniaEthiopiaEuro areaEurope & Central AsiaEurope & Central Asia (excluding high income)Europe & Central Asia (IDA & IBRD countries)European UnionFaroe IslandsFijiFinlandFragile and conflict affected situationsFranceFrench PolynesiaGabonGambia, TheGeorgiaGermanyGhanaGreeceGreenlandGrenadaGuamGuatemalaGuineaGuinea-BissauGuyanaHaitiHeavily indebted poor countries (HIPC)High incomeHondurasHong Kong SAR, ChinaHungaryIBRD onlyIcelandIDA & IBRD totalIDA blendIDA onlyIDA totalIndiaIndonesiaIran, Islamic Rep.IraqIrelandIsle of ManIsraelItalyJamaicaJapanJordanKazakhstanKenyaKiribatiKorea, Dem. People’s Rep.Korea, Rep.KosovoKuwaitKyrgyz RepublicLao PDRLate-demographic dividendLatin America & Caribbean Latin America & Caribbean (excluding high income)Latin America & the Caribbean (IDA & IBRD countries)LatviaLeast developed countries: UN classificationLebanonLesothoLiberiaLibyaLiechtensteinLithuaniaLow & middle incomeLow incomeLower middle incomeLuxembourgMacao SAR, ChinaMacedonia, FYRMadagascarMalawiMalaysiaMaldivesMaliMaltaMarshall IslandsMauritaniaMauritiusMexicoMicronesia, Fed. Sts.Middle East & North AfricaMiddle East & North Africa (excluding high income)Middle East & North Africa (IDA & IBRD countries)Middle incomeMoldovaMonacoMongoliaMontenegroMoroccoMozambiqueMyanmarNamibiaNepalNetherlandsNew CaledoniaNew ZealandNicaraguaNigerNigeriaNorth AmericaNorwayOECD membersOmanOther small statesPacific island small statesPakistanPalauPanamaPapua New GuineaParaguayPeruPhilippinesPolandPortugalPost-demographic dividendPre-demographic dividendPuerto RicoQatarRomaniaRussian FederationRwandaSamoaSan MarinoSao Tome and PrincipeSaudi ArabiaSenegalSerbiaSeychellesSierra LeoneSingaporeSint Maarten (Dutch part)Slovak RepublicSloveniaSmall statesSolomon IslandsSomaliaSouth AfricaSouth AsiaSouth Asia (IDA & IBRD)South SudanSpainSri LankaSt. Kitts and NevisSt. LuciaSt. Martin (French part)St. Vincent and the GrenadinesSub-Saharan Africa Sub-Saharan Africa (excluding high income)Sub-Saharan Africa (IDA & IBRD countries)SudanSurinameSwazilandSwedenSwitzerlandSyrian Arab RepublicTajikistanTanzaniaThailandTimor-LesteTogoTongaTrinidad and TobagoTunisiaTurkeyTurkmenistanUgandaUkraineUnited Arab EmiratesUnited KingdomUnited StatesUpper middle incomeUruguayUzbekistanVanuatuVenezuela, RBVietnamVirgin Islands (U.S.)West Bank and GazaWorldYemen, Rep.ZambiaZimbabwe Timeline:
This timeline shows a graph from 1961 to 2015 of Kiribati. No data until 1960. Number of actual observations by date: 55.
Source name:
World Development Indicators
Source organization:
(1) United Nations Population Division. World Population Prospects, (2) Census reports and other statistical publications from national statistical offices, (3) Eurostat: Demographic Statistics, (4) United Nations Statistical Division. Population and Vital Statistics Reprot (various years), (5) U.S. Census Bureau: International Database, and (6) Secretariat of the Pacific Community: Statistics and Demography Programme.
Categories, topics:
Health
Last updated:
apr 23, 2017
Indicators value changes by year
Maximum:
47.452
jan 1, 1961
At the date of observation
Value
Absolute change
Change from previous value
jan 1, 1961
47.452
+47.452
0.0%
jan 1, 1962
46.79
-0.662
-1.4%
jan 1, 1963
45.907
-0.883
-1.89%
jan 1, 1964
44.818
-1.089
-2.37%
jan 1, 1965
43.56
-1.258
-2.81%
jan 1, 1966
42.154
-1.406
-3.23%
jan 1, 1967
40.622
-1.532
-3.63%
jan 1, 1968
39.018
-1.604
-3.95%
jan 1, 1969
37.42
-1.598
-4.1%
jan 1, 1970
35.913
-1.507
-4.03%
jan 1, 1971
34.614
-1.299
-3.62%
jan 1, 1972
33.635
-0.979
-2.83%
jan 1, 1973
33.018
-0.617
-1.83%
jan 1, 1974
32.768
-0.25
-0.76%
jan 1, 1975
32.869
+0.101
0.31%
jan 1, 1976
33.266
+0.397
1.21%
jan 1, 1977
33.867
+0.601
1.81%
jan 1, 1978
34.55
+0.683
2.02%
jan 1, 1979
35.206
+0.656
1.9%
jan 1, 1980
35.774
+0.568
1.61%
jan 1, 1981
36.222
+0.448
1.25%
jan 1, 1982
36.552
+0.33
0.91%
jan 1, 1983
36.81
+0.258
0.71%
jan 1, 1984
37.026
+0.216
0.59%
jan 1, 1985
37.196
+0.17
0.46%
jan 1, 1986
37.31
+0.114
0.31%
jan 1, 1987
37.359
+0.049
0.13%
jan 1, 1988
37.332
-0.027
-0.07%
jan 1, 1989
37.22
-0.112
-0.3%
jan 1, 1990
37.019
-0.201
-0.54%
jan 1, 1991
36.713
-0.306
-0.83%
jan 1, 1992
36.289
-0.424
-1.15%
jan 1, 1993
35.754
-0.535
-1.47%
jan 1, 1994
35.126
-0.628
-1.76%
jan 1, 1995
34.431
-0.695
-1.98%
jan 1, 1996
33.699
-0.732
-2.13%
jan 1, 1997
32.965
-0.734
-2.18%
jan 1, 1998
32.259
-0.706
-2.14%
jan 1, 1999
31.613
-0.646
-2.0%
jan 1, 2000
31.048
-0.565
-1.79%
jan 1, 2001
30.583
-0.465
-1.5%
jan 1, 2002
30.228
-0.355
-1.16%
jan 1, 2003
29.965
-0.263
-0.87%
jan 1, 2004
29.775
-0.19
-0.63%
jan 1, 2005
29.647
-0.128
-0.43%
jan 1, 2006
29.572
-0.075
-0.25%
jan 1, 2007
29.537
-0.035
-0.12%
jan 1, 2008
29.528
-0.009
-0.03%
jan 1, 2009
29.526
-0.002
-0.01%
jan 1, 2010
29.513
-0.013
-0.04%
jan 1, 2011
29.468
-0.045
-0.15%
jan 1, 2012
29.377
-0.091
-0.31%
jan 1, 2013
29.235
-0.142
-0.48%
jan 1, 2014
29.044
-0.191
-0.65%
jan 1, 2015
28.8
-0.244
-0.84%
Ranking of countries by current statistics by years


Comments: