29
/
en
AIzaSyAYiBZKx7MnpbEhh9jyipgxe19OcubqV5w
April 1, 2024
34064
Fragile and conflict affected situations
FCS
false
2
1
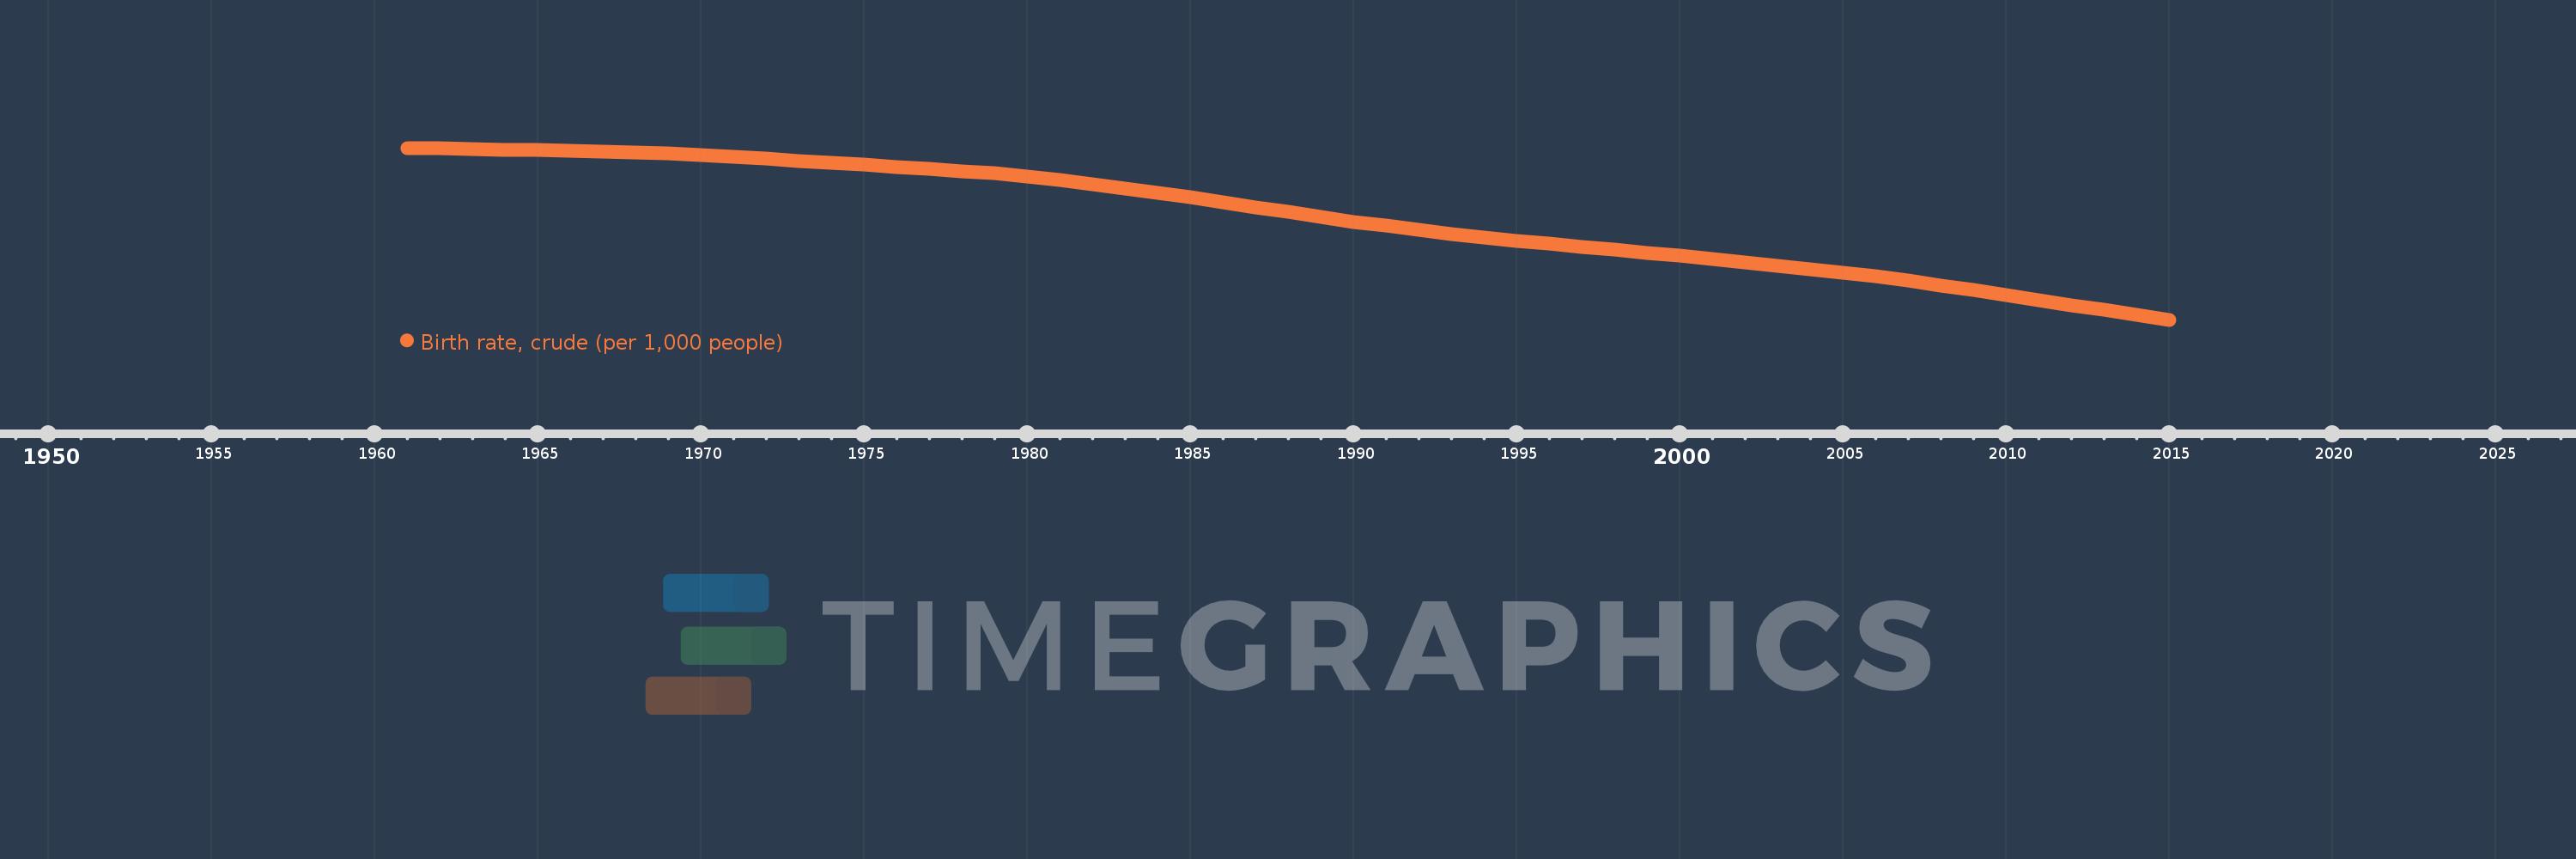
Birth rate, crude (per 1,000 people)
2015,2014,2013,2012,2011,2010,2009,2008,2007,2006,2005,2004,2003,2002,2001,2000,1999,1998,1997,1996,1995,1994,1993,1992,1991,1990,1989,1988,1987,1986,1985,1984,1983,1982,1981,1980,1979,1978,1977,1976,1975,1974,1973,1972,1971,1970,1969,1968,1967,1966,1965,1964,1963,1962,1961
This statistics in other country:
AfghanistanAlbaniaAlgeriaAmerican SamoaAndorraAngolaAntigua and BarbudaArab WorldArgentinaArmeniaArubaAustraliaAustriaAzerbaijanBahamas, TheBahrainBangladeshBarbadosBelarusBelgiumBelizeBeninBermudaBhutanBoliviaBosnia and HerzegovinaBotswanaBrazilBrunei DarussalamBulgariaBurkina FasoBurundiCabo VerdeCambodiaCameroonCanadaCaribbean small statesCayman IslandsCentral African RepublicCentral Europe and the BalticsChadChannel IslandsChileChinaColombiaComorosCongo, Dem. Rep.Congo, Rep.Costa RicaCote d'IvoireCroatiaCubaCuracaoCyprusCzech RepublicDenmarkDjiboutiDominicaDominican RepublicEarly-demographic dividendEast Asia & PacificEast Asia & Pacific (excluding high income)East Asia & Pacific (IDA & IBRD countries)EcuadorEgypt, Arab Rep.El SalvadorEquatorial GuineaEritreaEstoniaEthiopiaEuro areaEurope & Central AsiaEurope & Central Asia (excluding high income)Europe & Central Asia (IDA & IBRD countries)European UnionFaroe IslandsFijiFinlandFragile and conflict affected situationsFranceFrench PolynesiaGabonGambia, TheGeorgiaGermanyGhanaGreeceGreenlandGrenadaGuamGuatemalaGuineaGuinea-BissauGuyanaHaitiHeavily indebted poor countries (HIPC)High incomeHondurasHong Kong SAR, ChinaHungaryIBRD onlyIcelandIDA & IBRD totalIDA blendIDA onlyIDA totalIndiaIndonesiaIran, Islamic Rep.IraqIrelandIsle of ManIsraelItalyJamaicaJapanJordanKazakhstanKenyaKiribatiKorea, Dem. People’s Rep.Korea, Rep.KosovoKuwaitKyrgyz RepublicLao PDRLate-demographic dividendLatin America & Caribbean Latin America & Caribbean (excluding high income)Latin America & the Caribbean (IDA & IBRD countries)LatviaLeast developed countries: UN classificationLebanonLesothoLiberiaLibyaLiechtensteinLithuaniaLow & middle incomeLow incomeLower middle incomeLuxembourgMacao SAR, ChinaMacedonia, FYRMadagascarMalawiMalaysiaMaldivesMaliMaltaMarshall IslandsMauritaniaMauritiusMexicoMicronesia, Fed. Sts.Middle East & North AfricaMiddle East & North Africa (excluding high income)Middle East & North Africa (IDA & IBRD countries)Middle incomeMoldovaMonacoMongoliaMontenegroMoroccoMozambiqueMyanmarNamibiaNepalNetherlandsNew CaledoniaNew ZealandNicaraguaNigerNigeriaNorth AmericaNorwayOECD membersOmanOther small statesPacific island small statesPakistanPalauPanamaPapua New GuineaParaguayPeruPhilippinesPolandPortugalPost-demographic dividendPre-demographic dividendPuerto RicoQatarRomaniaRussian FederationRwandaSamoaSan MarinoSao Tome and PrincipeSaudi ArabiaSenegalSerbiaSeychellesSierra LeoneSingaporeSint Maarten (Dutch part)Slovak RepublicSloveniaSmall statesSolomon IslandsSomaliaSouth AfricaSouth AsiaSouth Asia (IDA & IBRD)South SudanSpainSri LankaSt. Kitts and NevisSt. LuciaSt. Martin (French part)St. Vincent and the GrenadinesSub-Saharan Africa Sub-Saharan Africa (excluding high income)Sub-Saharan Africa (IDA & IBRD countries)SudanSurinameSwazilandSwedenSwitzerlandSyrian Arab RepublicTajikistanTanzaniaThailandTimor-LesteTogoTongaTrinidad and TobagoTunisiaTurkeyTurkmenistanUgandaUkraineUnited Arab EmiratesUnited KingdomUnited StatesUpper middle incomeUruguayUzbekistanVanuatuVenezuela, RBVietnamVirgin Islands (U.S.)West Bank and GazaWorldYemen, Rep.ZambiaZimbabwe Timeline:
This timeline shows a graph from 1961 to 2015 of Fragile and conflict affected situations. No data until 1960. Number of actual observations by date: 55.
Source name:
World Development Indicators
Source organization:
(1) United Nations Population Division. World Population Prospects, (2) Census reports and other statistical publications from national statistical offices, (3) Eurostat: Demographic Statistics, (4) United Nations Statistical Division. Population and Vital Statistics Reprot (various years), (5) U.S. Census Bureau: International Database, and (6) Secretariat of the Pacific Community: Statistics and Demography Programme.
Categories, topics:
Health
Last updated:
apr 23, 2017
Indicators value changes by year
Minimum:
33.588
jan 1, 2015
Maximum:
46.795
jan 1, 1961
At the date of observation
Value
Absolute change
Change from previous value
jan 1, 1961
46.795
+46.795
0.0%
jan 1, 1962
46.744
-0.051
-0.11%
jan 1, 1963
46.706
-0.038
-0.08%
jan 1, 1964
46.674
-0.032
-0.07%
jan 1, 1965
46.64
-0.034
-0.07%
jan 1, 1966
46.596
-0.044
-0.09%
jan 1, 1967
46.534
-0.061
-0.13%
jan 1, 1968
46.454
-0.08
-0.17%
jan 1, 1969
46.355
-0.099
-0.21%
jan 1, 1970
46.236
-0.119
-0.26%
jan 1, 1971
46.1
-0.136
-0.29%
jan 1, 1972
45.954
-0.146
-0.32%
jan 1, 1973
45.804
-0.15
-0.33%
jan 1, 1974
45.654
-0.15
-0.33%
jan 1, 1975
45.505
-0.15
-0.33%
jan 1, 1976
45.353
-0.152
-0.33%
jan 1, 1977
45.194
-0.158
-0.35%
jan 1, 1978
45.023
-0.172
-0.38%
jan 1, 1979
44.83
-0.193
-0.43%
jan 1, 1980
44.611
-0.219
-0.49%
jan 1, 1981
44.361
-0.25
-0.56%
jan 1, 1982
43.978
-0.383
-0.86%
jan 1, 1983
43.683
-0.295
-0.67%
jan 1, 1984
43.325
-0.358
-0.82%
jan 1, 1985
42.989
-0.336
-0.78%
jan 1, 1986
42.611
-0.378
-0.88%
jan 1, 1987
42.235
-0.377
-0.88%
jan 1, 1988
41.86
-0.375
-0.89%
jan 1, 1989
41.484
-0.376
-0.9%
jan 1, 1990
41.111
-0.373
-0.9%
jan 1, 1991
40.809
-0.301
-0.73%
jan 1, 1992
40.486
-0.323
-0.79%
jan 1, 1993
40.175
-0.311
-0.77%
jan 1, 1994
39.916
-0.259
-0.64%
jan 1, 1995
39.671
-0.245
-0.61%
jan 1, 1996
39.441
-0.231
-0.58%
jan 1, 1997
39.21
-0.23
-0.58%
jan 1, 1998
38.969
-0.242
-0.62%
jan 1, 1999
38.741
-0.227
-0.58%
jan 1, 2000
38.519
-0.223
-0.58%
jan 1, 2001
38.277
-0.242
-0.63%
jan 1, 2002
38.02
-0.257
-0.67%
jan 1, 2003
37.759
-0.261
-0.69%
jan 1, 2004
37.479
-0.28
-0.74%
jan 1, 2005
37.205
-0.274
-0.73%
jan 1, 2006
36.908
-0.298
-0.8%
jan 1, 2007
36.576
-0.331
-0.9%
jan 1, 2008
36.231
-0.346
-0.94%
jan 1, 2009
35.856
-0.375
-1.04%
jan 1, 2010
35.483
-0.372
-1.04%
jan 1, 2011
35.103
-0.381
-1.07%
jan 1, 2012
34.719
-0.384
-1.09%
jan 1, 2013
34.337
-0.381
-1.1%
jan 1, 2014
33.96
-0.377
-1.1%
jan 1, 2015
33.588
-0.372
-1.09%
Ranking of countries by current statistics by years


Comments: