29
/
en
AIzaSyAYiBZKx7MnpbEhh9jyipgxe19OcubqV5w
April 1, 2024
70812
Armenia
ARM
true
2
1
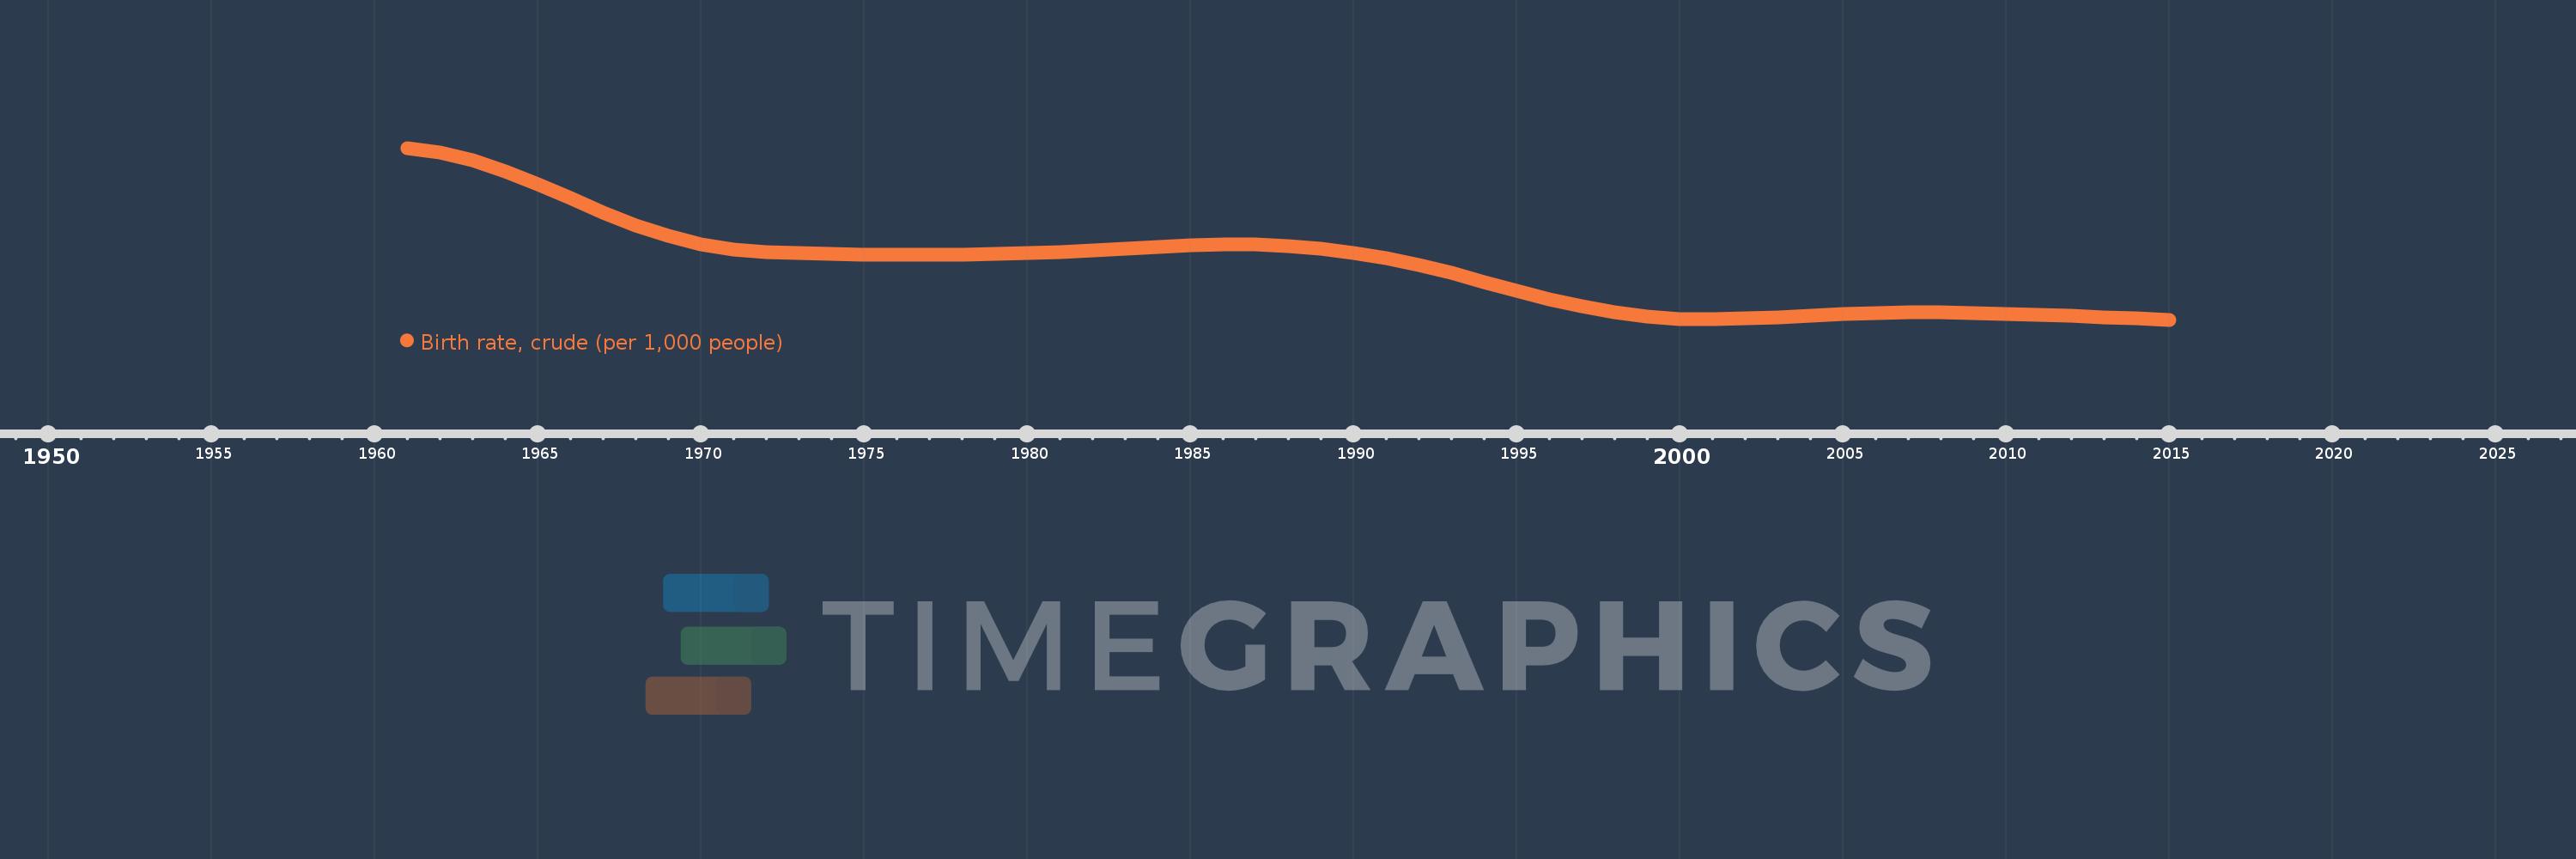
Birth rate, crude (per 1,000 people)
2015,2014,2013,2012,2011,2010,2009,2008,2007,2006,2005,2004,2003,2002,2001,2000,1999,1998,1997,1996,1995,1994,1993,1992,1991,1990,1989,1988,1987,1986,1985,1984,1983,1982,1981,1980,1979,1978,1977,1976,1975,1974,1973,1972,1971,1970,1969,1968,1967,1966,1965,1964,1963,1962,1961
This statistics in other country:
AfghanistanAlbaniaAlgeriaAmerican SamoaAndorraAngolaAntigua and BarbudaArab WorldArgentinaArmeniaArubaAustraliaAustriaAzerbaijanBahamas, TheBahrainBangladeshBarbadosBelarusBelgiumBelizeBeninBermudaBhutanBoliviaBosnia and HerzegovinaBotswanaBrazilBrunei DarussalamBulgariaBurkina FasoBurundiCabo VerdeCambodiaCameroonCanadaCaribbean small statesCayman IslandsCentral African RepublicCentral Europe and the BalticsChadChannel IslandsChileChinaColombiaComorosCongo, Dem. Rep.Congo, Rep.Costa RicaCote d'IvoireCroatiaCubaCuracaoCyprusCzech RepublicDenmarkDjiboutiDominicaDominican RepublicEarly-demographic dividendEast Asia & PacificEast Asia & Pacific (excluding high income)East Asia & Pacific (IDA & IBRD countries)EcuadorEgypt, Arab Rep.El SalvadorEquatorial GuineaEritreaEstoniaEthiopiaEuro areaEurope & Central AsiaEurope & Central Asia (excluding high income)Europe & Central Asia (IDA & IBRD countries)European UnionFaroe IslandsFijiFinlandFragile and conflict affected situationsFranceFrench PolynesiaGabonGambia, TheGeorgiaGermanyGhanaGreeceGreenlandGrenadaGuamGuatemalaGuineaGuinea-BissauGuyanaHaitiHeavily indebted poor countries (HIPC)High incomeHondurasHong Kong SAR, ChinaHungaryIBRD onlyIcelandIDA & IBRD totalIDA blendIDA onlyIDA totalIndiaIndonesiaIran, Islamic Rep.IraqIrelandIsle of ManIsraelItalyJamaicaJapanJordanKazakhstanKenyaKiribatiKorea, Dem. People’s Rep.Korea, Rep.KosovoKuwaitKyrgyz RepublicLao PDRLate-demographic dividendLatin America & Caribbean Latin America & Caribbean (excluding high income)Latin America & the Caribbean (IDA & IBRD countries)LatviaLeast developed countries: UN classificationLebanonLesothoLiberiaLibyaLiechtensteinLithuaniaLow & middle incomeLow incomeLower middle incomeLuxembourgMacao SAR, ChinaMacedonia, FYRMadagascarMalawiMalaysiaMaldivesMaliMaltaMarshall IslandsMauritaniaMauritiusMexicoMicronesia, Fed. Sts.Middle East & North AfricaMiddle East & North Africa (excluding high income)Middle East & North Africa (IDA & IBRD countries)Middle incomeMoldovaMonacoMongoliaMontenegroMoroccoMozambiqueMyanmarNamibiaNepalNetherlandsNew CaledoniaNew ZealandNicaraguaNigerNigeriaNorth AmericaNorwayOECD membersOmanOther small statesPacific island small statesPakistanPalauPanamaPapua New GuineaParaguayPeruPhilippinesPolandPortugalPost-demographic dividendPre-demographic dividendPuerto RicoQatarRomaniaRussian FederationRwandaSamoaSan MarinoSao Tome and PrincipeSaudi ArabiaSenegalSerbiaSeychellesSierra LeoneSingaporeSint Maarten (Dutch part)Slovak RepublicSloveniaSmall statesSolomon IslandsSomaliaSouth AfricaSouth AsiaSouth Asia (IDA & IBRD)South SudanSpainSri LankaSt. Kitts and NevisSt. LuciaSt. Martin (French part)St. Vincent and the GrenadinesSub-Saharan Africa Sub-Saharan Africa (excluding high income)Sub-Saharan Africa (IDA & IBRD countries)SudanSurinameSwazilandSwedenSwitzerlandSyrian Arab RepublicTajikistanTanzaniaThailandTimor-LesteTogoTongaTrinidad and TobagoTunisiaTurkeyTurkmenistanUgandaUkraineUnited Arab EmiratesUnited KingdomUnited StatesUpper middle incomeUruguayUzbekistanVanuatuVenezuela, RBVietnamVirgin Islands (U.S.)West Bank and GazaWorldYemen, Rep.ZambiaZimbabwe Timeline:
This timeline shows a graph from 1961 to 2015 of Armenia. No data until 1960. Number of actual observations by date: 55.
Source name:
World Development Indicators
Source organization:
(1) United Nations Population Division. World Population Prospects, (2) Census reports and other statistical publications from national statistical offices, (3) Eurostat: Demographic Statistics, (4) United Nations Statistical Division. Population and Vital Statistics Reprot (various years), (5) U.S. Census Bureau: International Database, and (6) Secretariat of the Pacific Community: Statistics and Demography Programme.
Categories, topics:
Health
Last updated:
apr 23, 2017
Indicators value changes by year
Minimum:
13.157
jan 1, 2015
Maximum:
36.696
jan 1, 1961
At the date of observation
Value
Absolute change
Change from previous value
jan 1, 1961
36.696
+36.696
0.0%
jan 1, 1962
36.039
-0.657
-1.79%
jan 1, 1963
34.973
-1.066
-2.96%
jan 1, 1964
33.51
-1.463
-4.18%
jan 1, 1965
31.731
-1.779
-5.31%
jan 1, 1966
29.78
-1.951
-6.15%
jan 1, 1967
27.837
-1.943
-6.52%
jan 1, 1968
26.072
-1.765
-6.34%
jan 1, 1969
24.615
-1.457
-5.59%
jan 1, 1970
23.53
-1.085
-4.41%
jan 1, 1971
22.826
-0.704
-2.99%
jan 1, 1972
22.448
-0.378
-1.66%
jan 1, 1973
22.264
-0.184
-0.82%
jan 1, 1974
22.162
-0.102
-0.46%
jan 1, 1975
22.099
-0.063
-0.28%
jan 1, 1976
22.053
-0.046
-0.21%
jan 1, 1977
22.028
-0.025
-0.11%
jan 1, 1978
22.049
+0.021
0.1%
jan 1, 1979
22.129
+0.08
0.36%
jan 1, 1980
22.255
+0.126
0.57%
jan 1, 1981
22.424
+0.169
0.76%
jan 1, 1982
22.638
+0.214
0.95%
jan 1, 1983
22.88
+0.242
1.07%
jan 1, 1984
23.122
+0.242
1.06%
jan 1, 1985
23.327
+0.205
0.89%
jan 1, 1986
23.446
+0.119
0.51%
jan 1, 1987
23.429
-0.017
-0.07%
jan 1, 1988
23.248
-0.181
-0.77%
jan 1, 1989
22.889
-0.359
-1.54%
jan 1, 1990
22.344
-0.545
-2.38%
jan 1, 1991
21.6
-0.744
-3.33%
jan 1, 1992
20.652
-0.948
-4.39%
jan 1, 1993
19.546
-1.106
-5.36%
jan 1, 1994
18.348
-1.198
-6.13%
jan 1, 1995
17.123
-1.225
-6.68%
jan 1, 1996
15.962
-1.161
-6.78%
jan 1, 1997
14.957
-1.005
-6.3%
jan 1, 1998
14.16
-0.797
-5.33%
jan 1, 1999
13.6
-0.56
-3.95%
jan 1, 2000
13.286
-0.314
-2.31%
jan 1, 2001
13.203
-0.083
-0.62%
jan 1, 2002
13.306
+0.103
0.78%
jan 1, 2003
13.511
+0.205
1.54%
jan 1, 2004
13.741
+0.23
1.7%
jan 1, 2005
13.949
+0.208
1.51%
jan 1, 2006
14.097
+0.148
1.06%
jan 1, 2007
14.164
+0.067
0.48%
jan 1, 2008
14.161
-0.003
-0.02%
jan 1, 2009
14.101
-0.06
-0.42%
jan 1, 2010
13.986
-0.115
-0.82%
jan 1, 2011
13.83
-0.156
-1.12%
jan 1, 2012
13.652
-0.178
-1.29%
jan 1, 2013
13.474
-0.178
-1.3%
jan 1, 2014
13.308
-0.166
-1.23%
jan 1, 2015
13.157
-0.151
-1.13%
Ranking of countries by current statistics by years


Comments: