29
/
en
AIzaSyAYiBZKx7MnpbEhh9jyipgxe19OcubqV5w
April 1, 2024
167156
Kenya
KEN
true
2
1
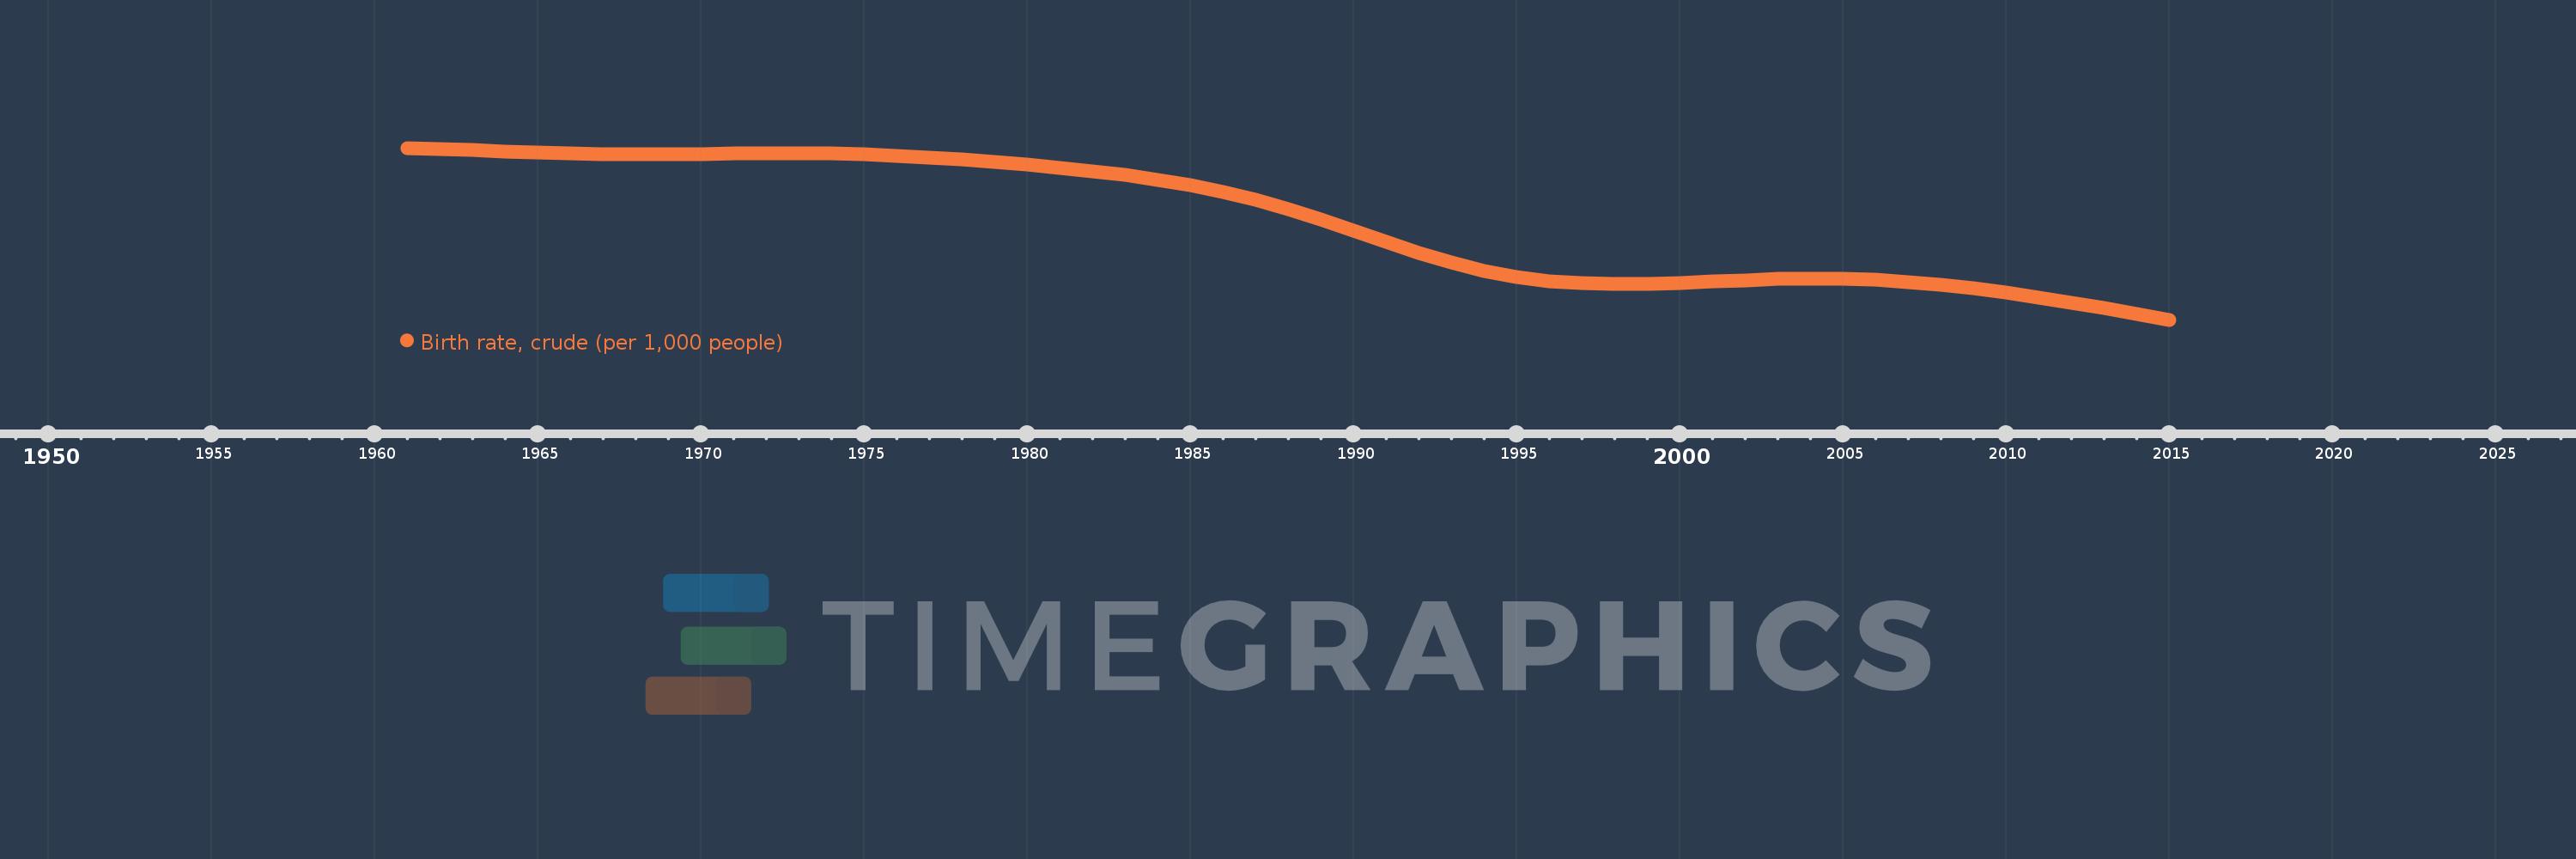
Birth rate, crude (per 1,000 people)
2015,2014,2013,2012,2011,2010,2009,2008,2007,2006,2005,2004,2003,2002,2001,2000,1999,1998,1997,1996,1995,1994,1993,1992,1991,1990,1989,1988,1987,1986,1985,1984,1983,1982,1981,1980,1979,1978,1977,1976,1975,1974,1973,1972,1971,1970,1969,1968,1967,1966,1965,1964,1963,1962,1961
This statistics in other country:
AfghanistanAlbaniaAlgeriaAmerican SamoaAndorraAngolaAntigua and BarbudaArab WorldArgentinaArmeniaArubaAustraliaAustriaAzerbaijanBahamas, TheBahrainBangladeshBarbadosBelarusBelgiumBelizeBeninBermudaBhutanBoliviaBosnia and HerzegovinaBotswanaBrazilBrunei DarussalamBulgariaBurkina FasoBurundiCabo VerdeCambodiaCameroonCanadaCaribbean small statesCayman IslandsCentral African RepublicCentral Europe and the BalticsChadChannel IslandsChileChinaColombiaComorosCongo, Dem. Rep.Congo, Rep.Costa RicaCote d'IvoireCroatiaCubaCuracaoCyprusCzech RepublicDenmarkDjiboutiDominicaDominican RepublicEarly-demographic dividendEast Asia & PacificEast Asia & Pacific (excluding high income)East Asia & Pacific (IDA & IBRD countries)EcuadorEgypt, Arab Rep.El SalvadorEquatorial GuineaEritreaEstoniaEthiopiaEuro areaEurope & Central AsiaEurope & Central Asia (excluding high income)Europe & Central Asia (IDA & IBRD countries)European UnionFaroe IslandsFijiFinlandFragile and conflict affected situationsFranceFrench PolynesiaGabonGambia, TheGeorgiaGermanyGhanaGreeceGreenlandGrenadaGuamGuatemalaGuineaGuinea-BissauGuyanaHaitiHeavily indebted poor countries (HIPC)High incomeHondurasHong Kong SAR, ChinaHungaryIBRD onlyIcelandIDA & IBRD totalIDA blendIDA onlyIDA totalIndiaIndonesiaIran, Islamic Rep.IraqIrelandIsle of ManIsraelItalyJamaicaJapanJordanKazakhstanKenyaKiribatiKorea, Dem. People’s Rep.Korea, Rep.KosovoKuwaitKyrgyz RepublicLao PDRLate-demographic dividendLatin America & Caribbean Latin America & Caribbean (excluding high income)Latin America & the Caribbean (IDA & IBRD countries)LatviaLeast developed countries: UN classificationLebanonLesothoLiberiaLibyaLiechtensteinLithuaniaLow & middle incomeLow incomeLower middle incomeLuxembourgMacao SAR, ChinaMacedonia, FYRMadagascarMalawiMalaysiaMaldivesMaliMaltaMarshall IslandsMauritaniaMauritiusMexicoMicronesia, Fed. Sts.Middle East & North AfricaMiddle East & North Africa (excluding high income)Middle East & North Africa (IDA & IBRD countries)Middle incomeMoldovaMonacoMongoliaMontenegroMoroccoMozambiqueMyanmarNamibiaNepalNetherlandsNew CaledoniaNew ZealandNicaraguaNigerNigeriaNorth AmericaNorwayOECD membersOmanOther small statesPacific island small statesPakistanPalauPanamaPapua New GuineaParaguayPeruPhilippinesPolandPortugalPost-demographic dividendPre-demographic dividendPuerto RicoQatarRomaniaRussian FederationRwandaSamoaSan MarinoSao Tome and PrincipeSaudi ArabiaSenegalSerbiaSeychellesSierra LeoneSingaporeSint Maarten (Dutch part)Slovak RepublicSloveniaSmall statesSolomon IslandsSomaliaSouth AfricaSouth AsiaSouth Asia (IDA & IBRD)South SudanSpainSri LankaSt. Kitts and NevisSt. LuciaSt. Martin (French part)St. Vincent and the GrenadinesSub-Saharan Africa Sub-Saharan Africa (excluding high income)Sub-Saharan Africa (IDA & IBRD countries)SudanSurinameSwazilandSwedenSwitzerlandSyrian Arab RepublicTajikistanTanzaniaThailandTimor-LesteTogoTongaTrinidad and TobagoTunisiaTurkeyTurkmenistanUgandaUkraineUnited Arab EmiratesUnited KingdomUnited StatesUpper middle incomeUruguayUzbekistanVanuatuVenezuela, RBVietnamVirgin Islands (U.S.)West Bank and GazaWorldYemen, Rep.ZambiaZimbabwe Timeline:
This timeline shows a graph from 1961 to 2015 of Kenya. No data until 1960. Number of actual observations by date: 55.
Source name:
World Development Indicators
Source organization:
(1) United Nations Population Division. World Population Prospects, (2) Census reports and other statistical publications from national statistical offices, (3) Eurostat: Demographic Statistics, (4) United Nations Statistical Division. Population and Vital Statistics Reprot (various years), (5) U.S. Census Bureau: International Database, and (6) Secretariat of the Pacific Community: Statistics and Demography Programme.
Categories, topics:
Health
Last updated:
apr 23, 2017
Indicators value changes by year
Minimum:
34.636
jan 1, 2015
Maximum:
51.273
jan 1, 1961
At the date of observation
Value
Absolute change
Change from previous value
jan 1, 1961
51.273
+51.273
0.0%
jan 1, 1962
51.172
-0.101
-0.2%
jan 1, 1963
51.061
-0.111
-0.22%
jan 1, 1964
50.948
-0.113
-0.22%
jan 1, 1965
50.841
-0.107
-0.21%
jan 1, 1966
50.752
-0.089
-0.18%
jan 1, 1967
50.695
-0.057
-0.11%
jan 1, 1968
50.67
-0.025
-0.05%
jan 1, 1969
50.674
+0.004
0.01%
jan 1, 1970
50.7
+0.026
0.05%
jan 1, 1971
50.735
+0.035
0.07%
jan 1, 1972
50.762
+0.027
0.05%
jan 1, 1973
50.763
+0.001
0.0%
jan 1, 1974
50.725
-0.038
-0.07%
jan 1, 1975
50.639
-0.086
-0.17%
jan 1, 1976
50.505
-0.134
-0.26%
jan 1, 1977
50.332
-0.173
-0.34%
jan 1, 1978
50.129
-0.203
-0.4%
jan 1, 1979
49.902
-0.227
-0.45%
jan 1, 1980
49.646
-0.256
-0.51%
jan 1, 1981
49.356
-0.29
-0.58%
jan 1, 1982
49.025
-0.331
-0.67%
jan 1, 1983
48.641
-0.384
-0.78%
jan 1, 1984
48.193
-0.448
-0.92%
jan 1, 1985
47.67
-0.523
-1.09%
jan 1, 1986
47.042
-0.628
-1.32%
jan 1, 1987
46.279
-0.763
-1.62%
jan 1, 1988
45.38
-0.899
-1.94%
jan 1, 1989
44.37
-1.01
-2.23%
jan 1, 1990
43.284
-1.086
-2.45%
jan 1, 1991
42.18
-1.104
-2.55%
jan 1, 1992
41.126
-1.054
-2.5%
jan 1, 1993
40.18
-0.946
-2.3%
jan 1, 1994
39.389
-0.791
-1.97%
jan 1, 1995
38.781
-0.608
-1.54%
jan 1, 1996
38.372
-0.409
-1.05%
jan 1, 1997
38.16
-0.212
-0.55%
jan 1, 1998
38.096
-0.064
-0.17%
jan 1, 1999
38.129
+0.033
0.09%
jan 1, 2000
38.226
+0.097
0.25%
jan 1, 2001
38.35
+0.124
0.32%
jan 1, 2002
38.473
+0.123
0.32%
jan 1, 2003
38.571
+0.098
0.25%
jan 1, 2004
38.624
+0.053
0.14%
jan 1, 2005
38.609
-0.015
-0.04%
jan 1, 2006
38.506
-0.103
-0.27%
jan 1, 2007
38.308
-0.198
-0.51%
jan 1, 2008
38.026
-0.282
-0.74%
jan 1, 2009
37.676
-0.35
-0.92%
jan 1, 2010
37.264
-0.412
-1.09%
jan 1, 2011
36.798
-0.466
-1.25%
jan 1, 2012
36.289
-0.509
-1.38%
jan 1, 2013
35.749
-0.54
-1.49%
jan 1, 2014
35.194
-0.555
-1.55%
jan 1, 2015
34.636
-0.558
-1.59%
Ranking of countries by current statistics by years


Comments: