29
/
en
AIzaSyAYiBZKx7MnpbEhh9jyipgxe19OcubqV5w
April 1, 2024
243375
Solomon Islands
SLB
true
2
1
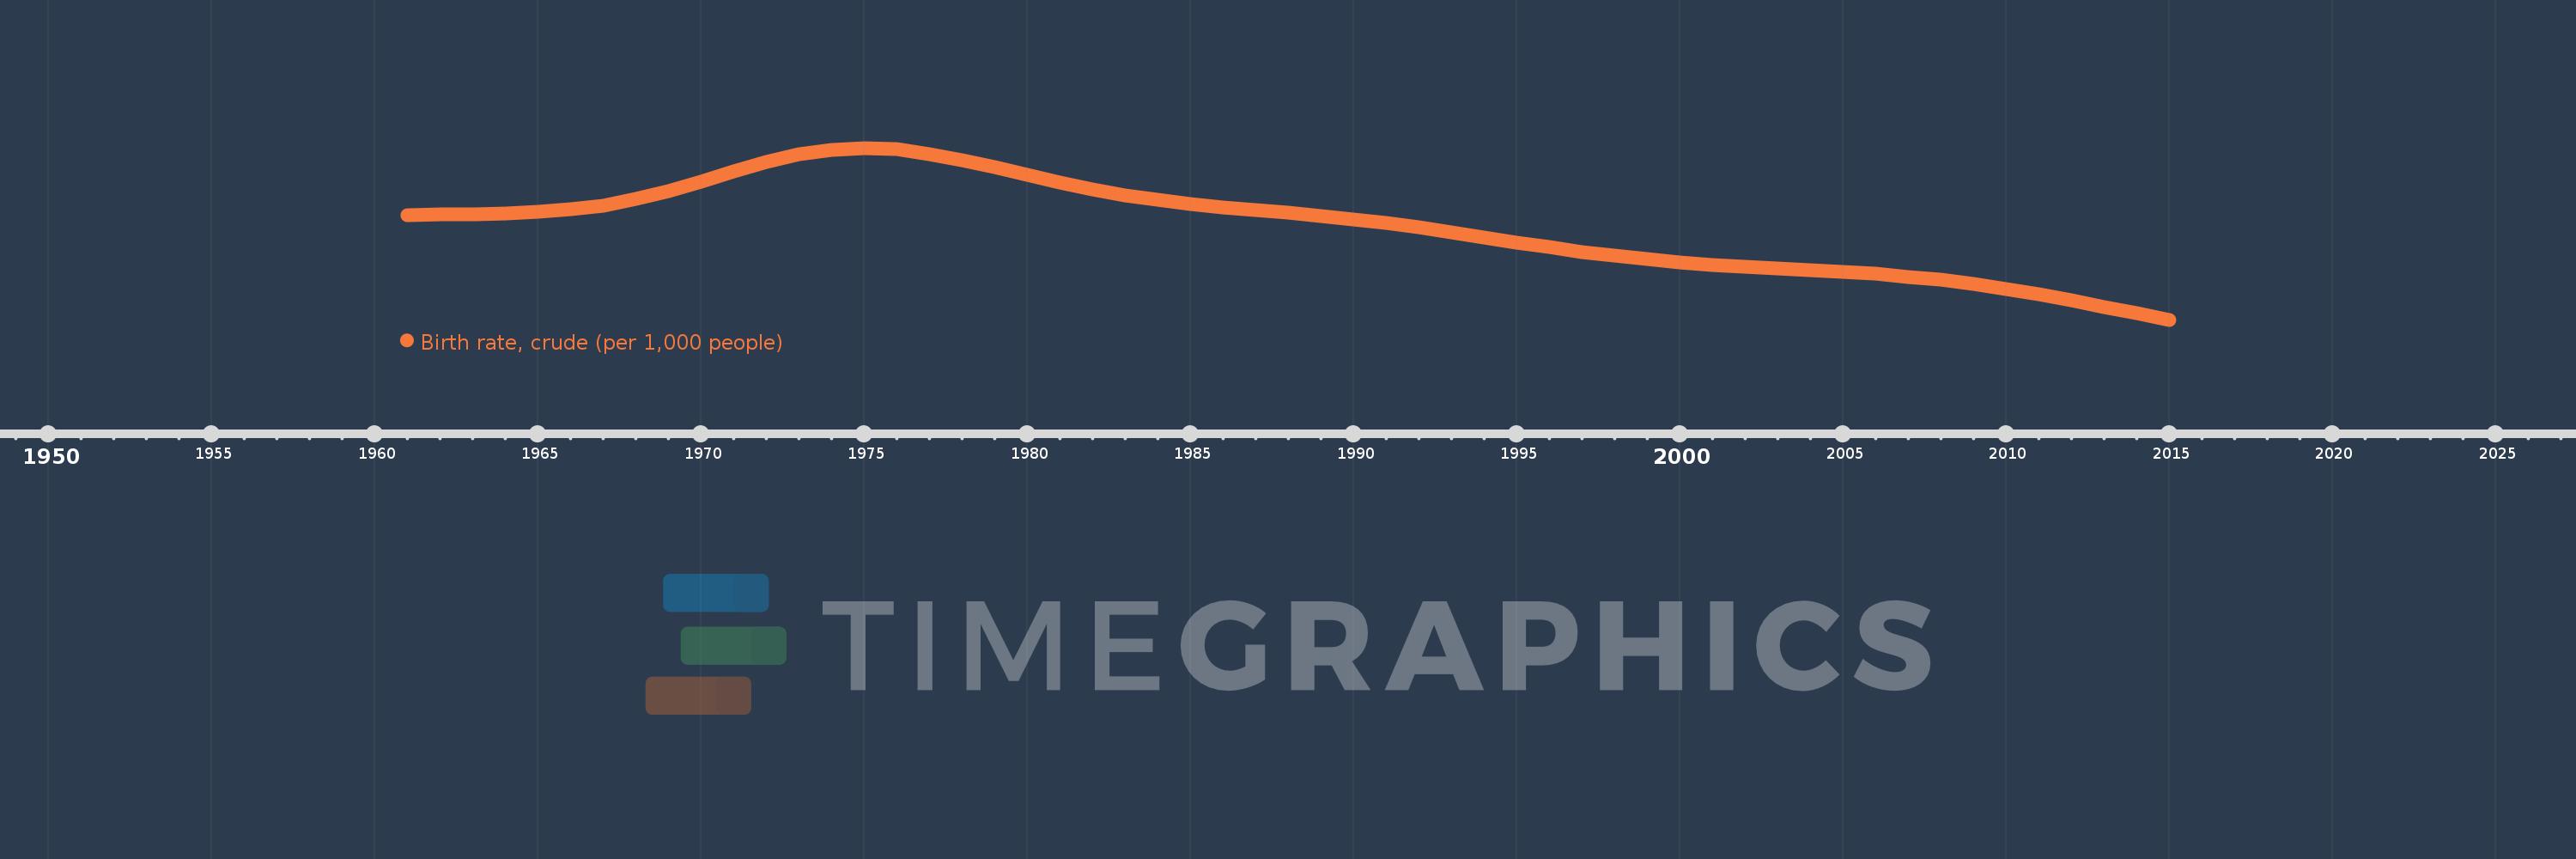
Birth rate, crude (per 1,000 people)
2015,2014,2013,2012,2011,2010,2009,2008,2007,2006,2005,2004,2003,2002,2001,2000,1999,1998,1997,1996,1995,1994,1993,1992,1991,1990,1989,1988,1987,1986,1985,1984,1983,1982,1981,1980,1979,1978,1977,1976,1975,1974,1973,1972,1971,1970,1969,1968,1967,1966,1965,1964,1963,1962,1961
This statistics in other country:
AfghanistanAlbaniaAlgeriaAmerican SamoaAndorraAngolaAntigua and BarbudaArab WorldArgentinaArmeniaArubaAustraliaAustriaAzerbaijanBahamas, TheBahrainBangladeshBarbadosBelarusBelgiumBelizeBeninBermudaBhutanBoliviaBosnia and HerzegovinaBotswanaBrazilBrunei DarussalamBulgariaBurkina FasoBurundiCabo VerdeCambodiaCameroonCanadaCaribbean small statesCayman IslandsCentral African RepublicCentral Europe and the BalticsChadChannel IslandsChileChinaColombiaComorosCongo, Dem. Rep.Congo, Rep.Costa RicaCote d'IvoireCroatiaCubaCuracaoCyprusCzech RepublicDenmarkDjiboutiDominicaDominican RepublicEarly-demographic dividendEast Asia & PacificEast Asia & Pacific (excluding high income)East Asia & Pacific (IDA & IBRD countries)EcuadorEgypt, Arab Rep.El SalvadorEquatorial GuineaEritreaEstoniaEthiopiaEuro areaEurope & Central AsiaEurope & Central Asia (excluding high income)Europe & Central Asia (IDA & IBRD countries)European UnionFaroe IslandsFijiFinlandFragile and conflict affected situationsFranceFrench PolynesiaGabonGambia, TheGeorgiaGermanyGhanaGreeceGreenlandGrenadaGuamGuatemalaGuineaGuinea-BissauGuyanaHaitiHeavily indebted poor countries (HIPC)High incomeHondurasHong Kong SAR, ChinaHungaryIBRD onlyIcelandIDA & IBRD totalIDA blendIDA onlyIDA totalIndiaIndonesiaIran, Islamic Rep.IraqIrelandIsle of ManIsraelItalyJamaicaJapanJordanKazakhstanKenyaKiribatiKorea, Dem. People’s Rep.Korea, Rep.KosovoKuwaitKyrgyz RepublicLao PDRLate-demographic dividendLatin America & Caribbean Latin America & Caribbean (excluding high income)Latin America & the Caribbean (IDA & IBRD countries)LatviaLeast developed countries: UN classificationLebanonLesothoLiberiaLibyaLiechtensteinLithuaniaLow & middle incomeLow incomeLower middle incomeLuxembourgMacao SAR, ChinaMacedonia, FYRMadagascarMalawiMalaysiaMaldivesMaliMaltaMarshall IslandsMauritaniaMauritiusMexicoMicronesia, Fed. Sts.Middle East & North AfricaMiddle East & North Africa (excluding high income)Middle East & North Africa (IDA & IBRD countries)Middle incomeMoldovaMonacoMongoliaMontenegroMoroccoMozambiqueMyanmarNamibiaNepalNetherlandsNew CaledoniaNew ZealandNicaraguaNigerNigeriaNorth AmericaNorwayOECD membersOmanOther small statesPacific island small statesPakistanPalauPanamaPapua New GuineaParaguayPeruPhilippinesPolandPortugalPost-demographic dividendPre-demographic dividendPuerto RicoQatarRomaniaRussian FederationRwandaSamoaSan MarinoSao Tome and PrincipeSaudi ArabiaSenegalSerbiaSeychellesSierra LeoneSingaporeSint Maarten (Dutch part)Slovak RepublicSloveniaSmall statesSolomon IslandsSomaliaSouth AfricaSouth AsiaSouth Asia (IDA & IBRD)South SudanSpainSri LankaSt. Kitts and NevisSt. LuciaSt. Martin (French part)St. Vincent and the GrenadinesSub-Saharan Africa Sub-Saharan Africa (excluding high income)Sub-Saharan Africa (IDA & IBRD countries)SudanSurinameSwazilandSwedenSwitzerlandSyrian Arab RepublicTajikistanTanzaniaThailandTimor-LesteTogoTongaTrinidad and TobagoTunisiaTurkeyTurkmenistanUgandaUkraineUnited Arab EmiratesUnited KingdomUnited StatesUpper middle incomeUruguayUzbekistanVanuatuVenezuela, RBVietnamVirgin Islands (U.S.)West Bank and GazaWorldYemen, Rep.ZambiaZimbabwe Timeline:
This timeline shows a graph from 1961 to 2015 of Solomon Islands. No data until 1960. Number of actual observations by date: 55.
Source name:
World Development Indicators
Source organization:
(1) United Nations Population Division. World Population Prospects, (2) Census reports and other statistical publications from national statistical offices, (3) Eurostat: Demographic Statistics, (4) United Nations Statistical Division. Population and Vital Statistics Reprot (various years), (5) U.S. Census Bureau: International Database, and (6) Secretariat of the Pacific Community: Statistics and Demography Programme.
Categories, topics:
Health
Last updated:
apr 23, 2017
Indicators value changes by year
Minimum:
29.921
jan 1, 2015
Maximum:
47.808
jan 1, 1975
At the date of observation
Value
Absolute change
Change from previous value
jan 1, 1961
40.782
+40.782
0.0%
jan 1, 1962
40.864
+0.082
0.2%
jan 1, 1963
40.937
+0.073
0.18%
jan 1, 1964
41.022
+0.085
0.21%
jan 1, 1965
41.148
+0.126
0.31%
jan 1, 1966
41.387
+0.239
0.58%
jan 1, 1967
41.821
+0.434
1.05%
jan 1, 1968
42.473
+0.652
1.56%
jan 1, 1969
43.327
+0.854
2.01%
jan 1, 1970
44.33
+1.003
2.31%
jan 1, 1971
45.384
+1.054
2.38%
jan 1, 1972
46.359
+0.975
2.15%
jan 1, 1973
47.138
+0.779
1.68%
jan 1, 1974
47.634
+0.496
1.05%
jan 1, 1975
47.808
+0.174
0.37%
jan 1, 1976
47.651
-0.157
-0.33%
jan 1, 1977
47.193
-0.458
-0.96%
jan 1, 1978
46.535
-0.658
-1.39%
jan 1, 1979
45.776
-0.759
-1.63%
jan 1, 1980
44.977
-0.799
-1.75%
jan 1, 1981
44.203
-0.774
-1.72%
jan 1, 1982
43.504
-0.699
-1.58%
jan 1, 1983
42.894
-0.61
-1.4%
jan 1, 1984
42.376
-0.518
-1.21%
jan 1, 1985
41.954
-0.422
-1.0%
jan 1, 1986
41.617
-0.337
-0.8%
jan 1, 1987
41.333
-0.284
-0.68%
jan 1, 1988
41.057
-0.276
-0.67%
jan 1, 1989
40.752
-0.305
-0.74%
jan 1, 1990
40.402
-0.35
-0.86%
jan 1, 1991
39.996
-0.406
-1.0%
jan 1, 1992
39.531
-0.465
-1.16%
jan 1, 1993
39.028
-0.503
-1.27%
jan 1, 1994
38.508
-0.52
-1.33%
jan 1, 1995
37.984
-0.524
-1.36%
jan 1, 1996
37.476
-0.508
-1.34%
jan 1, 1997
37.004
-0.472
-1.26%
jan 1, 1998
36.577
-0.427
-1.15%
jan 1, 1999
36.202
-0.375
-1.03%
jan 1, 2000
35.881
-0.321
-0.89%
jan 1, 2001
35.615
-0.266
-0.74%
jan 1, 2002
35.403
-0.212
-0.6%
jan 1, 2003
35.226
-0.177
-0.5%
jan 1, 2004
35.061
-0.165
-0.47%
jan 1, 2005
34.889
-0.172
-0.49%
jan 1, 2006
34.68
-0.209
-0.6%
jan 1, 2007
34.409
-0.271
-0.78%
jan 1, 2008
34.063
-0.346
-1.01%
jan 1, 2009
33.637
-0.426
-1.25%
jan 1, 2010
33.132
-0.505
-1.5%
jan 1, 2011
32.555
-0.577
-1.74%
jan 1, 2012
31.918
-0.637
-1.96%
jan 1, 2013
31.25
-0.668
-2.09%
jan 1, 2014
30.578
-0.672
-2.15%
jan 1, 2015
29.921
-0.657
-2.15%
Ranking of countries by current statistics by years


Comments: