29
/
en
AIzaSyAYiBZKx7MnpbEhh9jyipgxe19OcubqV5w
April 1, 2024
270326
Turkmenistan
TKM
true
2
1
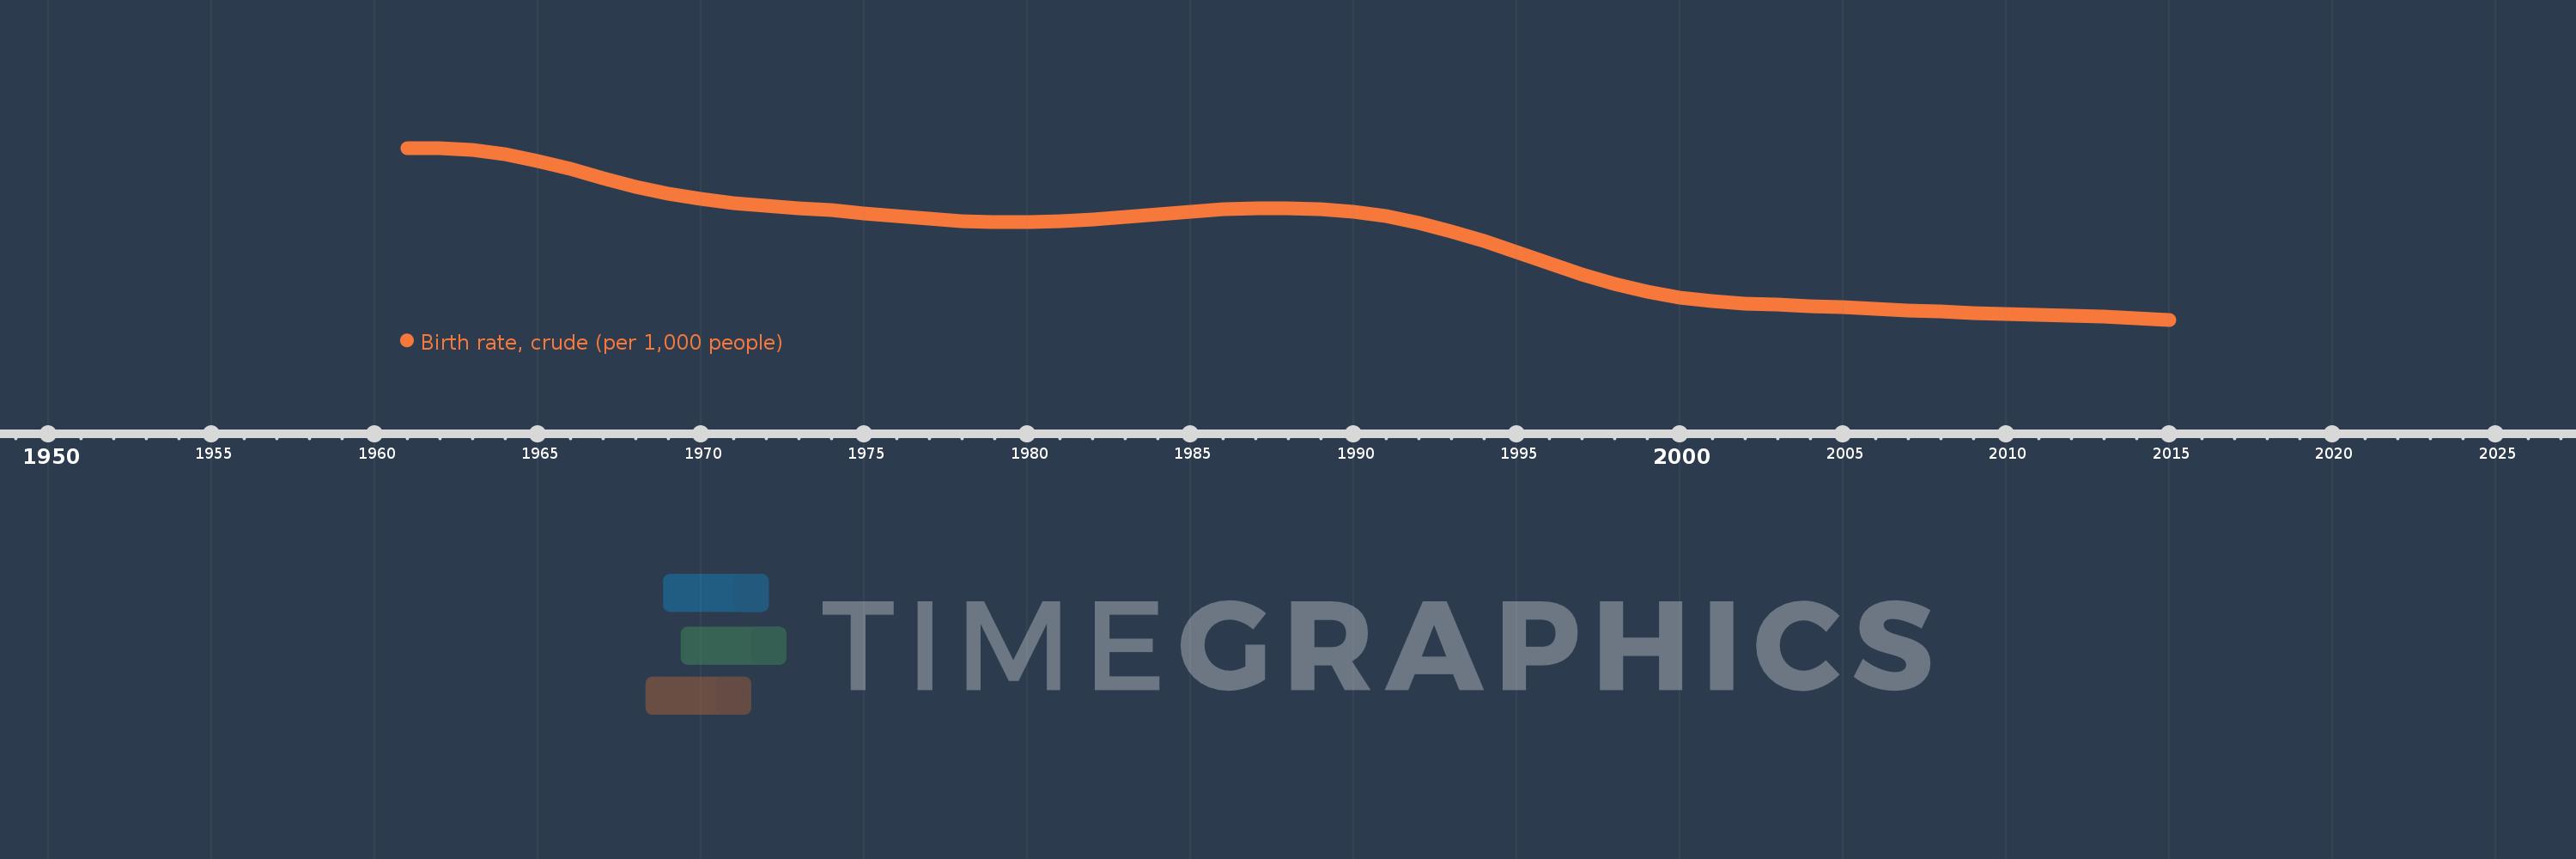
Birth rate, crude (per 1,000 people)
2015,2014,2013,2012,2011,2010,2009,2008,2007,2006,2005,2004,2003,2002,2001,2000,1999,1998,1997,1996,1995,1994,1993,1992,1991,1990,1989,1988,1987,1986,1985,1984,1983,1982,1981,1980,1979,1978,1977,1976,1975,1974,1973,1972,1971,1970,1969,1968,1967,1966,1965,1964,1963,1962,1961
This statistics in other country:
AfghanistanAlbaniaAlgeriaAmerican SamoaAndorraAngolaAntigua and BarbudaArab WorldArgentinaArmeniaArubaAustraliaAustriaAzerbaijanBahamas, TheBahrainBangladeshBarbadosBelarusBelgiumBelizeBeninBermudaBhutanBoliviaBosnia and HerzegovinaBotswanaBrazilBrunei DarussalamBulgariaBurkina FasoBurundiCabo VerdeCambodiaCameroonCanadaCaribbean small statesCayman IslandsCentral African RepublicCentral Europe and the BalticsChadChannel IslandsChileChinaColombiaComorosCongo, Dem. Rep.Congo, Rep.Costa RicaCote d'IvoireCroatiaCubaCuracaoCyprusCzech RepublicDenmarkDjiboutiDominicaDominican RepublicEarly-demographic dividendEast Asia & PacificEast Asia & Pacific (excluding high income)East Asia & Pacific (IDA & IBRD countries)EcuadorEgypt, Arab Rep.El SalvadorEquatorial GuineaEritreaEstoniaEthiopiaEuro areaEurope & Central AsiaEurope & Central Asia (excluding high income)Europe & Central Asia (IDA & IBRD countries)European UnionFaroe IslandsFijiFinlandFragile and conflict affected situationsFranceFrench PolynesiaGabonGambia, TheGeorgiaGermanyGhanaGreeceGreenlandGrenadaGuamGuatemalaGuineaGuinea-BissauGuyanaHaitiHeavily indebted poor countries (HIPC)High incomeHondurasHong Kong SAR, ChinaHungaryIBRD onlyIcelandIDA & IBRD totalIDA blendIDA onlyIDA totalIndiaIndonesiaIran, Islamic Rep.IraqIrelandIsle of ManIsraelItalyJamaicaJapanJordanKazakhstanKenyaKiribatiKorea, Dem. People’s Rep.Korea, Rep.KosovoKuwaitKyrgyz RepublicLao PDRLate-demographic dividendLatin America & Caribbean Latin America & Caribbean (excluding high income)Latin America & the Caribbean (IDA & IBRD countries)LatviaLeast developed countries: UN classificationLebanonLesothoLiberiaLibyaLiechtensteinLithuaniaLow & middle incomeLow incomeLower middle incomeLuxembourgMacao SAR, ChinaMacedonia, FYRMadagascarMalawiMalaysiaMaldivesMaliMaltaMarshall IslandsMauritaniaMauritiusMexicoMicronesia, Fed. Sts.Middle East & North AfricaMiddle East & North Africa (excluding high income)Middle East & North Africa (IDA & IBRD countries)Middle incomeMoldovaMonacoMongoliaMontenegroMoroccoMozambiqueMyanmarNamibiaNepalNetherlandsNew CaledoniaNew ZealandNicaraguaNigerNigeriaNorth AmericaNorwayOECD membersOmanOther small statesPacific island small statesPakistanPalauPanamaPapua New GuineaParaguayPeruPhilippinesPolandPortugalPost-demographic dividendPre-demographic dividendPuerto RicoQatarRomaniaRussian FederationRwandaSamoaSan MarinoSao Tome and PrincipeSaudi ArabiaSenegalSerbiaSeychellesSierra LeoneSingaporeSint Maarten (Dutch part)Slovak RepublicSloveniaSmall statesSolomon IslandsSomaliaSouth AfricaSouth AsiaSouth Asia (IDA & IBRD)South SudanSpainSri LankaSt. Kitts and NevisSt. LuciaSt. Martin (French part)St. Vincent and the GrenadinesSub-Saharan Africa Sub-Saharan Africa (excluding high income)Sub-Saharan Africa (IDA & IBRD countries)SudanSurinameSwazilandSwedenSwitzerlandSyrian Arab RepublicTajikistanTanzaniaThailandTimor-LesteTogoTongaTrinidad and TobagoTunisiaTurkeyTurkmenistanUgandaUkraineUnited Arab EmiratesUnited KingdomUnited StatesUpper middle incomeUruguayUzbekistanVanuatuVenezuela, RBVietnamVirgin Islands (U.S.)West Bank and GazaWorldYemen, Rep.ZambiaZimbabwe Timeline:
This timeline shows a graph from 1961 to 2015 of Turkmenistan. No data until 1960. Number of actual observations by date: 55.
Source name:
World Development Indicators
Source organization:
(1) United Nations Population Division. World Population Prospects, (2) Census reports and other statistical publications from national statistical offices, (3) Eurostat: Demographic Statistics, (4) United Nations Statistical Division. Population and Vital Statistics Reprot (various years), (5) U.S. Census Bureau: International Database, and (6) Secretariat of the Pacific Community: Statistics and Demography Programme.
Categories, topics:
Health
Last updated:
apr 23, 2017
Indicators value changes by year
Minimum:
21.103
jan 1, 2015
At the date of observation
Value
Absolute change
Change from previous value
jan 1, 1961
44.664
+44.664
0.0%
jan 1, 1962
44.67
+0.006
0.01%
jan 1, 1963
44.402
-0.268
-0.6%
jan 1, 1964
43.807
-0.595
-1.34%
jan 1, 1965
42.899
-0.908
-2.07%
jan 1, 1966
41.762
-1.137
-2.65%
jan 1, 1967
40.534
-1.228
-2.94%
jan 1, 1968
39.373
-1.161
-2.86%
jan 1, 1969
38.4
-0.973
-2.47%
jan 1, 1970
37.658
-0.742
-1.93%
jan 1, 1971
37.135
-0.523
-1.39%
jan 1, 1972
36.766
-0.369
-0.99%
jan 1, 1973
36.444
-0.322
-0.88%
jan 1, 1974
36.095
-0.349
-0.96%
jan 1, 1975
35.708
-0.387
-1.07%
jan 1, 1976
35.305
-0.403
-1.13%
jan 1, 1977
34.934
-0.371
-1.05%
jan 1, 1978
34.653
-0.281
-0.8%
jan 1, 1979
34.503
-0.15
-0.43%
jan 1, 1980
34.488
-0.015
-0.04%
jan 1, 1981
34.614
+0.126
0.37%
jan 1, 1982
34.871
+0.257
0.74%
jan 1, 1983
35.215
+0.344
0.99%
jan 1, 1984
35.586
+0.371
1.05%
jan 1, 1985
35.938
+0.352
0.99%
jan 1, 1986
36.219
+0.281
0.78%
jan 1, 1987
36.384
+0.165
0.46%
jan 1, 1988
36.407
+0.023
0.06%
jan 1, 1989
36.258
-0.149
-0.41%
jan 1, 1990
35.91
-0.348
-0.96%
jan 1, 1991
35.313
-0.597
-1.66%
jan 1, 1992
34.422
-0.891
-2.52%
jan 1, 1993
33.26
-1.162
-3.38%
jan 1, 1994
31.886
-1.374
-4.13%
jan 1, 1995
30.365
-1.521
-4.77%
jan 1, 1996
28.807
-1.558
-5.13%
jan 1, 1997
27.332
-1.475
-5.12%
jan 1, 1998
26.032
-1.3
-4.76%
jan 1, 1999
24.974
-1.058
-4.06%
jan 1, 2000
24.188
-0.786
-3.15%
jan 1, 2001
23.663
-0.525
-2.17%
jan 1, 2002
23.351
-0.312
-1.32%
jan 1, 2003
23.152
-0.199
-0.85%
jan 1, 2004
22.985
-0.167
-0.72%
jan 1, 2005
22.815
-0.17
-0.74%
jan 1, 2006
22.624
-0.191
-0.84%
jan 1, 2007
22.421
-0.203
-0.9%
jan 1, 2008
22.231
-0.19
-0.85%
jan 1, 2009
22.069
-0.162
-0.73%
jan 1, 2010
21.928
-0.141
-0.64%
jan 1, 2011
21.796
-0.132
-0.6%
jan 1, 2012
21.659
-0.137
-0.63%
jan 1, 2013
21.505
-0.154
-0.71%
jan 1, 2014
21.322
-0.183
-0.85%
jan 1, 2015
21.103
-0.219
-1.03%
Ranking of countries by current statistics by years


Comments: