29
/
en
AIzaSyAYiBZKx7MnpbEhh9jyipgxe19OcubqV5w
April 1, 2024
64361
Albania
ALB
true
2
1
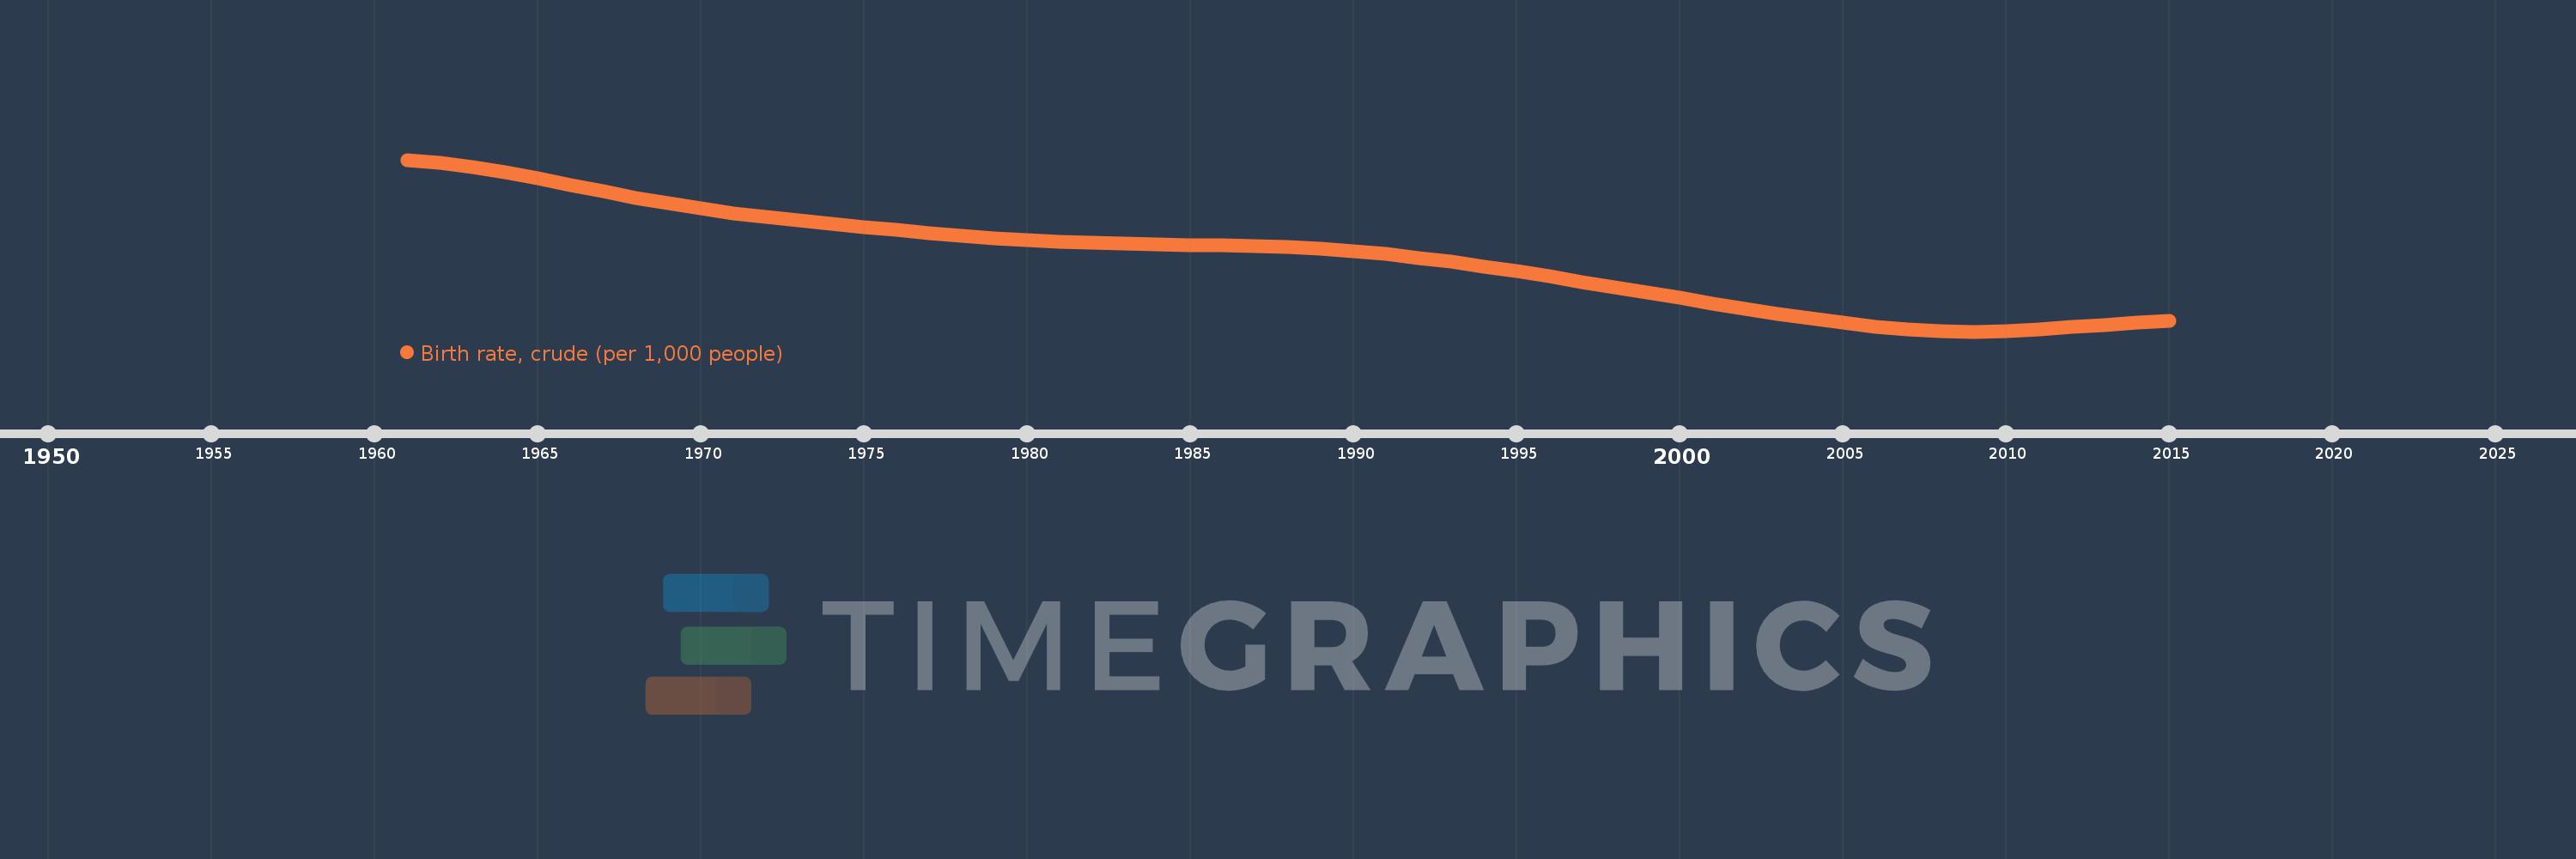
Birth rate, crude (per 1,000 people)
2015,2014,2013,2012,2011,2010,2009,2008,2007,2006,2005,2004,2003,2002,2001,2000,1999,1998,1997,1996,1995,1994,1993,1992,1991,1990,1989,1988,1987,1986,1985,1984,1983,1982,1981,1980,1979,1978,1977,1976,1975,1974,1973,1972,1971,1970,1969,1968,1967,1966,1965,1964,1963,1962,1961
This statistics in other country:
AfghanistanAlbaniaAlgeriaAmerican SamoaAndorraAngolaAntigua and BarbudaArab WorldArgentinaArmeniaArubaAustraliaAustriaAzerbaijanBahamas, TheBahrainBangladeshBarbadosBelarusBelgiumBelizeBeninBermudaBhutanBoliviaBosnia and HerzegovinaBotswanaBrazilBrunei DarussalamBulgariaBurkina FasoBurundiCabo VerdeCambodiaCameroonCanadaCaribbean small statesCayman IslandsCentral African RepublicCentral Europe and the BalticsChadChannel IslandsChileChinaColombiaComorosCongo, Dem. Rep.Congo, Rep.Costa RicaCote d'IvoireCroatiaCubaCuracaoCyprusCzech RepublicDenmarkDjiboutiDominicaDominican RepublicEarly-demographic dividendEast Asia & PacificEast Asia & Pacific (excluding high income)East Asia & Pacific (IDA & IBRD countries)EcuadorEgypt, Arab Rep.El SalvadorEquatorial GuineaEritreaEstoniaEthiopiaEuro areaEurope & Central AsiaEurope & Central Asia (excluding high income)Europe & Central Asia (IDA & IBRD countries)European UnionFaroe IslandsFijiFinlandFragile and conflict affected situationsFranceFrench PolynesiaGabonGambia, TheGeorgiaGermanyGhanaGreeceGreenlandGrenadaGuamGuatemalaGuineaGuinea-BissauGuyanaHaitiHeavily indebted poor countries (HIPC)High incomeHondurasHong Kong SAR, ChinaHungaryIBRD onlyIcelandIDA & IBRD totalIDA blendIDA onlyIDA totalIndiaIndonesiaIran, Islamic Rep.IraqIrelandIsle of ManIsraelItalyJamaicaJapanJordanKazakhstanKenyaKiribatiKorea, Dem. People’s Rep.Korea, Rep.KosovoKuwaitKyrgyz RepublicLao PDRLate-demographic dividendLatin America & Caribbean Latin America & Caribbean (excluding high income)Latin America & the Caribbean (IDA & IBRD countries)LatviaLeast developed countries: UN classificationLebanonLesothoLiberiaLibyaLiechtensteinLithuaniaLow & middle incomeLow incomeLower middle incomeLuxembourgMacao SAR, ChinaMacedonia, FYRMadagascarMalawiMalaysiaMaldivesMaliMaltaMarshall IslandsMauritaniaMauritiusMexicoMicronesia, Fed. Sts.Middle East & North AfricaMiddle East & North Africa (excluding high income)Middle East & North Africa (IDA & IBRD countries)Middle incomeMoldovaMonacoMongoliaMontenegroMoroccoMozambiqueMyanmarNamibiaNepalNetherlandsNew CaledoniaNew ZealandNicaraguaNigerNigeriaNorth AmericaNorwayOECD membersOmanOther small statesPacific island small statesPakistanPalauPanamaPapua New GuineaParaguayPeruPhilippinesPolandPortugalPost-demographic dividendPre-demographic dividendPuerto RicoQatarRomaniaRussian FederationRwandaSamoaSan MarinoSao Tome and PrincipeSaudi ArabiaSenegalSerbiaSeychellesSierra LeoneSingaporeSint Maarten (Dutch part)Slovak RepublicSloveniaSmall statesSolomon IslandsSomaliaSouth AfricaSouth AsiaSouth Asia (IDA & IBRD)South SudanSpainSri LankaSt. Kitts and NevisSt. LuciaSt. Martin (French part)St. Vincent and the GrenadinesSub-Saharan Africa Sub-Saharan Africa (excluding high income)Sub-Saharan Africa (IDA & IBRD countries)SudanSurinameSwazilandSwedenSwitzerlandSyrian Arab RepublicTajikistanTanzaniaThailandTimor-LesteTogoTongaTrinidad and TobagoTunisiaTurkeyTurkmenistanUgandaUkraineUnited Arab EmiratesUnited KingdomUnited StatesUpper middle incomeUruguayUzbekistanVanuatuVenezuela, RBVietnamVirgin Islands (U.S.)West Bank and GazaWorldYemen, Rep.ZambiaZimbabwe Timeline:
This timeline shows a graph from 1961 to 2015 of Albania. No data until 1960. Number of actual observations by date: 55.
Source name:
World Development Indicators
Source organization:
(1) United Nations Population Division. World Population Prospects, (2) Census reports and other statistical publications from national statistical offices, (3) Eurostat: Demographic Statistics, (4) United Nations Statistical Division. Population and Vital Statistics Reprot (various years), (5) U.S. Census Bureau: International Database, and (6) Secretariat of the Pacific Community: Statistics and Demography Programme.
Categories, topics:
Health
Last updated:
apr 23, 2017
Indicators value changes by year
Minimum:
11.561
jan 1, 2009
Maximum:
40.925
jan 1, 1961
At the date of observation
Value
Absolute change
Change from previous value
jan 1, 1961
40.925
+40.925
0.0%
jan 1, 1962
40.369
-0.556
-1.36%
jan 1, 1963
39.628
-0.741
-1.84%
jan 1, 1964
38.724
-0.904
-2.28%
jan 1, 1965
37.696
-1.028
-2.65%
jan 1, 1966
36.599
-1.097
-2.91%
jan 1, 1967
35.494
-1.105
-3.02%
jan 1, 1968
34.431
-1.063
-2.99%
jan 1, 1969
33.451
-0.98
-2.85%
jan 1, 1970
32.579
-0.872
-2.61%
jan 1, 1971
31.821
-0.758
-2.33%
jan 1, 1972
31.161
-0.66
-2.07%
jan 1, 1973
30.558
-0.603
-1.94%
jan 1, 1974
29.983
-0.575
-1.88%
jan 1, 1975
29.43
-0.553
-1.84%
jan 1, 1976
28.898
-0.532
-1.81%
jan 1, 1977
28.397
-0.501
-1.73%
jan 1, 1978
27.94
-0.457
-1.61%
jan 1, 1979
27.536
-0.404
-1.45%
jan 1, 1980
27.186
-0.35
-1.27%
jan 1, 1981
26.901
-0.285
-1.05%
jan 1, 1982
26.688
-0.213
-0.79%
jan 1, 1983
26.541
-0.147
-0.55%
jan 1, 1984
26.44
-0.101
-0.38%
jan 1, 1985
26.363
-0.077
-0.29%
jan 1, 1986
26.278
-0.085
-0.32%
jan 1, 1987
26.152
-0.126
-0.48%
jan 1, 1988
25.959
-0.193
-0.74%
jan 1, 1989
25.677
-0.282
-1.09%
jan 1, 1990
25.29
-0.387
-1.51%
jan 1, 1991
24.789
-0.501
-1.98%
jan 1, 1992
24.173
-0.616
-2.48%
jan 1, 1993
23.464
-0.709
-2.93%
jan 1, 1994
22.686
-0.778
-3.32%
jan 1, 1995
21.854
-0.832
-3.67%
jan 1, 1996
20.98
-0.874
-4.0%
jan 1, 1997
20.075
-0.905
-4.31%
jan 1, 1998
19.15
-0.925
-4.61%
jan 1, 1999
18.22
-0.93
-4.86%
jan 1, 2000
17.302
-0.918
-5.04%
jan 1, 2001
16.401
-0.901
-5.21%
jan 1, 2002
15.513
-0.888
-5.41%
jan 1, 2003
14.642
-0.871
-5.61%
jan 1, 2004
13.806
-0.836
-5.71%
jan 1, 2005
13.036
-0.77
-5.58%
jan 1, 2006
12.383
-0.653
-5.01%
jan 1, 2007
11.906
-0.477
-3.85%
jan 1, 2008
11.631
-0.275
-2.31%
jan 1, 2009
11.561
-0.07
-0.6%
jan 1, 2010
11.679
+0.118
1.02%
jan 1, 2011
11.952
+0.273
2.34%
jan 1, 2012
12.325
+0.373
3.12%
jan 1, 2013
12.73
+0.405
3.29%
jan 1, 2014
13.106
+0.376
2.95%
jan 1, 2015
13.414
+0.308
2.35%
Ranking of countries by current statistics by years


Comments: