29
/
en
AIzaSyAYiBZKx7MnpbEhh9jyipgxe19OcubqV5w
April 1, 2024
150025
Honduras
HND
true
2
1
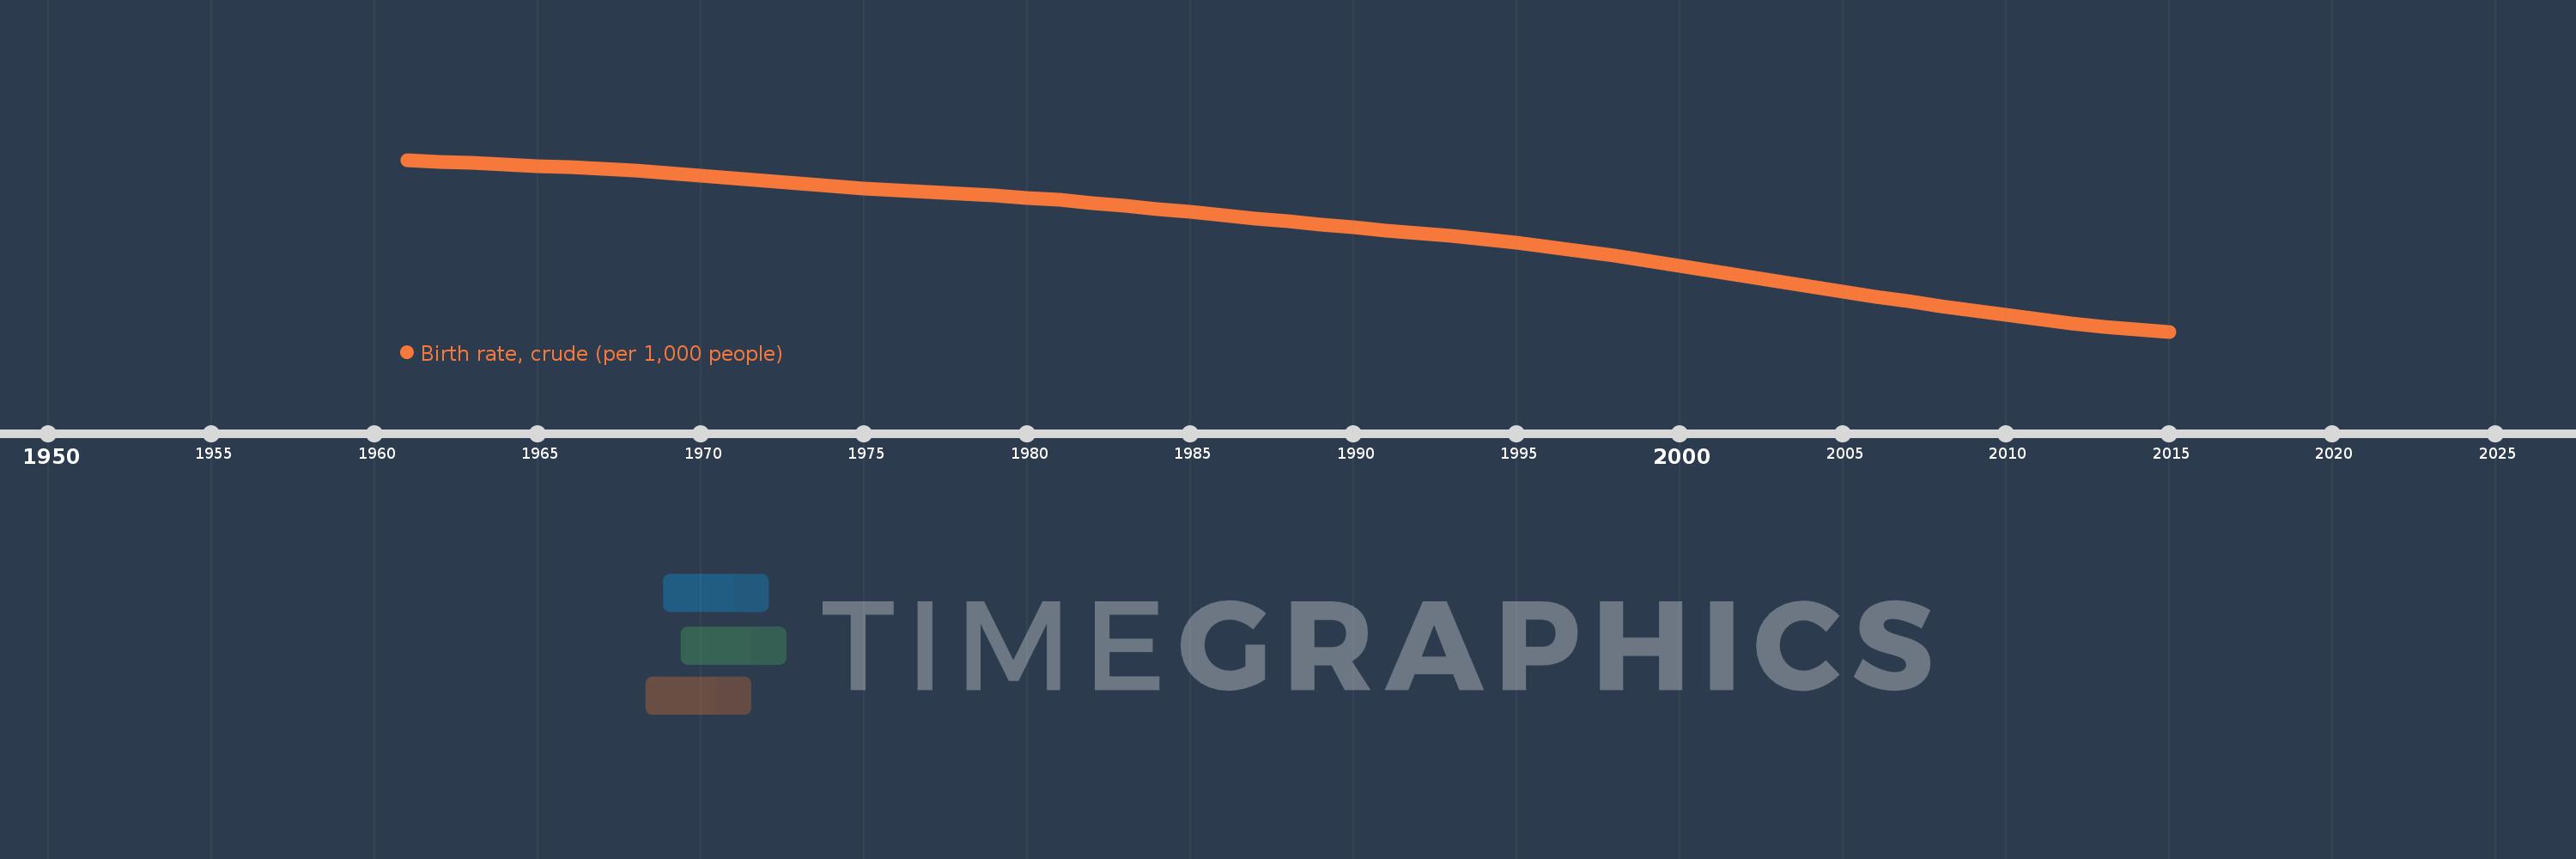
Birth rate, crude (per 1,000 people)
2015,2014,2013,2012,2011,2010,2009,2008,2007,2006,2005,2004,2003,2002,2001,2000,1999,1998,1997,1996,1995,1994,1993,1992,1991,1990,1989,1988,1987,1986,1985,1984,1983,1982,1981,1980,1979,1978,1977,1976,1975,1974,1973,1972,1971,1970,1969,1968,1967,1966,1965,1964,1963,1962,1961
This statistics in other country:
AfghanistanAlbaniaAlgeriaAmerican SamoaAndorraAngolaAntigua and BarbudaArab WorldArgentinaArmeniaArubaAustraliaAustriaAzerbaijanBahamas, TheBahrainBangladeshBarbadosBelarusBelgiumBelizeBeninBermudaBhutanBoliviaBosnia and HerzegovinaBotswanaBrazilBrunei DarussalamBulgariaBurkina FasoBurundiCabo VerdeCambodiaCameroonCanadaCaribbean small statesCayman IslandsCentral African RepublicCentral Europe and the BalticsChadChannel IslandsChileChinaColombiaComorosCongo, Dem. Rep.Congo, Rep.Costa RicaCote d'IvoireCroatiaCubaCuracaoCyprusCzech RepublicDenmarkDjiboutiDominicaDominican RepublicEarly-demographic dividendEast Asia & PacificEast Asia & Pacific (excluding high income)East Asia & Pacific (IDA & IBRD countries)EcuadorEgypt, Arab Rep.El SalvadorEquatorial GuineaEritreaEstoniaEthiopiaEuro areaEurope & Central AsiaEurope & Central Asia (excluding high income)Europe & Central Asia (IDA & IBRD countries)European UnionFaroe IslandsFijiFinlandFragile and conflict affected situationsFranceFrench PolynesiaGabonGambia, TheGeorgiaGermanyGhanaGreeceGreenlandGrenadaGuamGuatemalaGuineaGuinea-BissauGuyanaHaitiHeavily indebted poor countries (HIPC)High incomeHondurasHong Kong SAR, ChinaHungaryIBRD onlyIcelandIDA & IBRD totalIDA blendIDA onlyIDA totalIndiaIndonesiaIran, Islamic Rep.IraqIrelandIsle of ManIsraelItalyJamaicaJapanJordanKazakhstanKenyaKiribatiKorea, Dem. People’s Rep.Korea, Rep.KosovoKuwaitKyrgyz RepublicLao PDRLate-demographic dividendLatin America & Caribbean Latin America & Caribbean (excluding high income)Latin America & the Caribbean (IDA & IBRD countries)LatviaLeast developed countries: UN classificationLebanonLesothoLiberiaLibyaLiechtensteinLithuaniaLow & middle incomeLow incomeLower middle incomeLuxembourgMacao SAR, ChinaMacedonia, FYRMadagascarMalawiMalaysiaMaldivesMaliMaltaMarshall IslandsMauritaniaMauritiusMexicoMicronesia, Fed. Sts.Middle East & North AfricaMiddle East & North Africa (excluding high income)Middle East & North Africa (IDA & IBRD countries)Middle incomeMoldovaMonacoMongoliaMontenegroMoroccoMozambiqueMyanmarNamibiaNepalNetherlandsNew CaledoniaNew ZealandNicaraguaNigerNigeriaNorth AmericaNorwayOECD membersOmanOther small statesPacific island small statesPakistanPalauPanamaPapua New GuineaParaguayPeruPhilippinesPolandPortugalPost-demographic dividendPre-demographic dividendPuerto RicoQatarRomaniaRussian FederationRwandaSamoaSan MarinoSao Tome and PrincipeSaudi ArabiaSenegalSerbiaSeychellesSierra LeoneSingaporeSint Maarten (Dutch part)Slovak RepublicSloveniaSmall statesSolomon IslandsSomaliaSouth AfricaSouth AsiaSouth Asia (IDA & IBRD)South SudanSpainSri LankaSt. Kitts and NevisSt. LuciaSt. Martin (French part)St. Vincent and the GrenadinesSub-Saharan Africa Sub-Saharan Africa (excluding high income)Sub-Saharan Africa (IDA & IBRD countries)SudanSurinameSwazilandSwedenSwitzerlandSyrian Arab RepublicTajikistanTanzaniaThailandTimor-LesteTogoTongaTrinidad and TobagoTunisiaTurkeyTurkmenistanUgandaUkraineUnited Arab EmiratesUnited KingdomUnited StatesUpper middle incomeUruguayUzbekistanVanuatuVenezuela, RBVietnamVirgin Islands (U.S.)West Bank and GazaWorldYemen, Rep.ZambiaZimbabwe Timeline:
This timeline shows a graph from 1961 to 2015 of Honduras. No data until 1960. Number of actual observations by date: 55.
Source name:
World Development Indicators
Source organization:
(1) United Nations Population Division. World Population Prospects, (2) Census reports and other statistical publications from national statistical offices, (3) Eurostat: Demographic Statistics, (4) United Nations Statistical Division. Population and Vital Statistics Reprot (various years), (5) U.S. Census Bureau: International Database, and (6) Secretariat of the Pacific Community: Statistics and Demography Programme.
Categories, topics:
Health
Last updated:
apr 23, 2017
Indicators value changes by year
Minimum:
21.203
jan 1, 2015
Maximum:
50.296
jan 1, 1961
At the date of observation
Value
Absolute change
Change from previous value
jan 1, 1961
50.296
+50.296
0.0%
jan 1, 1962
49.995
-0.301
-0.6%
jan 1, 1963
49.717
-0.278
-0.56%
jan 1, 1964
49.466
-0.251
-0.5%
jan 1, 1965
49.237
-0.229
-0.46%
jan 1, 1966
49.009
-0.228
-0.46%
jan 1, 1967
48.754
-0.255
-0.52%
jan 1, 1968
48.449
-0.305
-0.63%
jan 1, 1969
48.082
-0.367
-0.76%
jan 1, 1970
47.656
-0.426
-0.89%
jan 1, 1971
47.191
-0.465
-0.98%
jan 1, 1972
46.717
-0.474
-1.0%
jan 1, 1973
46.264
-0.453
-0.97%
jan 1, 1974
45.854
-0.41
-0.89%
jan 1, 1975
45.491
-0.363
-0.79%
jan 1, 1976
45.168
-0.323
-0.71%
jan 1, 1977
44.87
-0.298
-0.66%
jan 1, 1978
44.57
-0.3
-0.67%
jan 1, 1979
44.244
-0.326
-0.73%
jan 1, 1980
43.883
-0.361
-0.82%
jan 1, 1981
43.476
-0.407
-0.93%
jan 1, 1982
43.02
-0.456
-1.05%
jan 1, 1983
42.524
-0.496
-1.15%
jan 1, 1984
41.998
-0.526
-1.24%
jan 1, 1985
41.452
-0.546
-1.3%
jan 1, 1986
40.898
-0.554
-1.34%
jan 1, 1987
40.353
-0.545
-1.33%
jan 1, 1988
39.826
-0.527
-1.31%
jan 1, 1989
39.319
-0.507
-1.27%
jan 1, 1990
38.83
-0.489
-1.24%
jan 1, 1991
38.35
-0.48
-1.24%
jan 1, 1992
37.866
-0.484
-1.26%
jan 1, 1993
37.359
-0.507
-1.34%
jan 1, 1994
36.814
-0.545
-1.46%
jan 1, 1995
36.221
-0.593
-1.61%
jan 1, 1996
35.569
-0.652
-1.8%
jan 1, 1997
34.853
-0.716
-2.01%
jan 1, 1998
34.08
-0.773
-2.22%
jan 1, 1999
33.26
-0.82
-2.41%
jan 1, 2000
32.403
-0.857
-2.58%
jan 1, 2001
31.52
-0.883
-2.73%
jan 1, 2002
30.623
-0.897
-2.85%
jan 1, 2003
29.726
-0.897
-2.93%
jan 1, 2004
28.84
-0.886
-2.98%
jan 1, 2005
27.977
-0.863
-2.99%
jan 1, 2006
27.137
-0.84
-3.0%
jan 1, 2007
26.318
-0.819
-3.02%
jan 1, 2008
25.514
-0.804
-3.05%
jan 1, 2009
24.728
-0.786
-3.08%
jan 1, 2010
23.971
-0.757
-3.06%
jan 1, 2011
23.261
-0.71
-2.96%
jan 1, 2012
22.622
-0.639
-2.75%
jan 1, 2013
22.065
-0.557
-2.46%
jan 1, 2014
21.593
-0.472
-2.14%
jan 1, 2015
21.203
-0.39
-1.81%
Ranking of countries by current statistics by years


Comments: