29
/
en
AIzaSyAYiBZKx7MnpbEhh9jyipgxe19OcubqV5w
April 1, 2024
97071
Cabo Verde
CPV
true
2
1
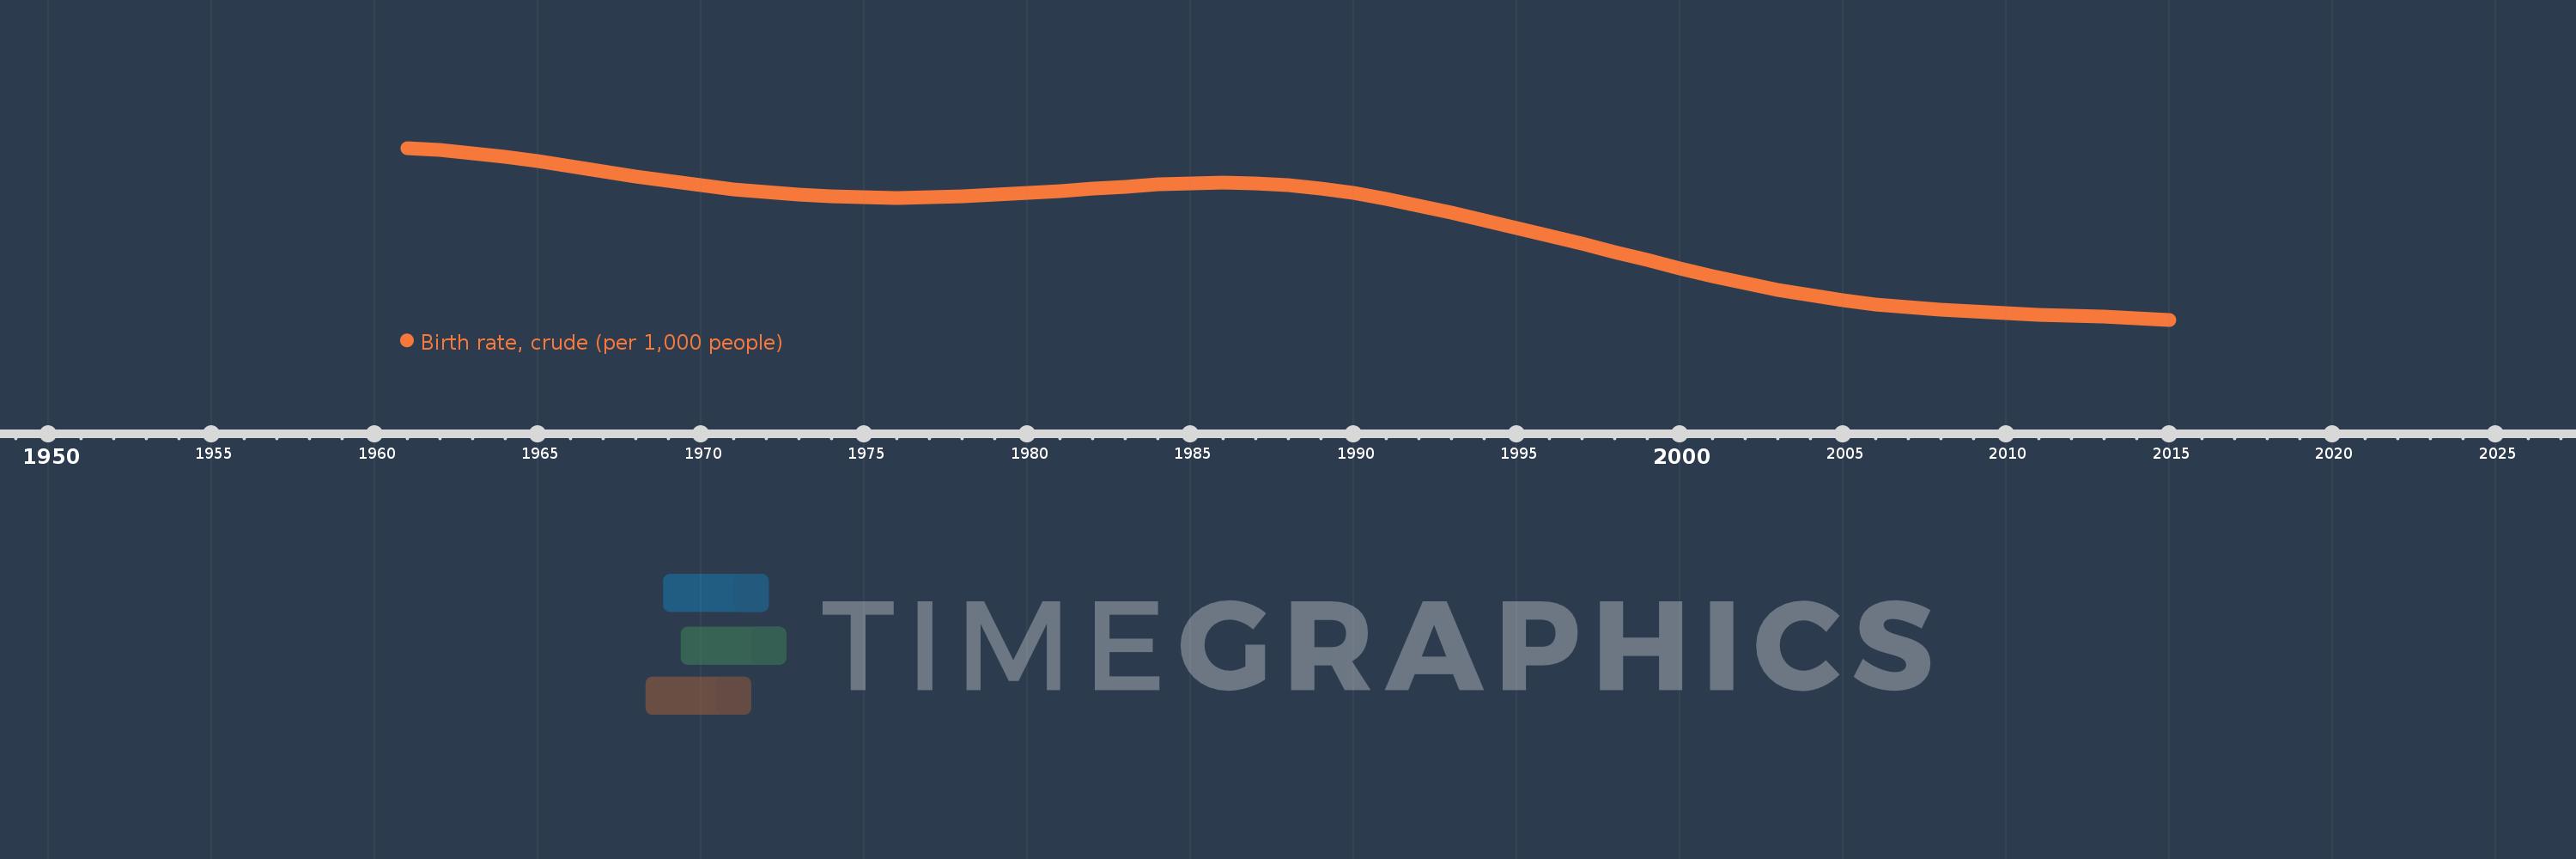
Birth rate, crude (per 1,000 people)
2015,2014,2013,2012,2011,2010,2009,2008,2007,2006,2005,2004,2003,2002,2001,2000,1999,1998,1997,1996,1995,1994,1993,1992,1991,1990,1989,1988,1987,1986,1985,1984,1983,1982,1981,1980,1979,1978,1977,1976,1975,1974,1973,1972,1971,1970,1969,1968,1967,1966,1965,1964,1963,1962,1961
This statistics in other country:
AfghanistanAlbaniaAlgeriaAmerican SamoaAndorraAngolaAntigua and BarbudaArab WorldArgentinaArmeniaArubaAustraliaAustriaAzerbaijanBahamas, TheBahrainBangladeshBarbadosBelarusBelgiumBelizeBeninBermudaBhutanBoliviaBosnia and HerzegovinaBotswanaBrazilBrunei DarussalamBulgariaBurkina FasoBurundiCabo VerdeCambodiaCameroonCanadaCaribbean small statesCayman IslandsCentral African RepublicCentral Europe and the BalticsChadChannel IslandsChileChinaColombiaComorosCongo, Dem. Rep.Congo, Rep.Costa RicaCote d'IvoireCroatiaCubaCuracaoCyprusCzech RepublicDenmarkDjiboutiDominicaDominican RepublicEarly-demographic dividendEast Asia & PacificEast Asia & Pacific (excluding high income)East Asia & Pacific (IDA & IBRD countries)EcuadorEgypt, Arab Rep.El SalvadorEquatorial GuineaEritreaEstoniaEthiopiaEuro areaEurope & Central AsiaEurope & Central Asia (excluding high income)Europe & Central Asia (IDA & IBRD countries)European UnionFaroe IslandsFijiFinlandFragile and conflict affected situationsFranceFrench PolynesiaGabonGambia, TheGeorgiaGermanyGhanaGreeceGreenlandGrenadaGuamGuatemalaGuineaGuinea-BissauGuyanaHaitiHeavily indebted poor countries (HIPC)High incomeHondurasHong Kong SAR, ChinaHungaryIBRD onlyIcelandIDA & IBRD totalIDA blendIDA onlyIDA totalIndiaIndonesiaIran, Islamic Rep.IraqIrelandIsle of ManIsraelItalyJamaicaJapanJordanKazakhstanKenyaKiribatiKorea, Dem. People’s Rep.Korea, Rep.KosovoKuwaitKyrgyz RepublicLao PDRLate-demographic dividendLatin America & Caribbean Latin America & Caribbean (excluding high income)Latin America & the Caribbean (IDA & IBRD countries)LatviaLeast developed countries: UN classificationLebanonLesothoLiberiaLibyaLiechtensteinLithuaniaLow & middle incomeLow incomeLower middle incomeLuxembourgMacao SAR, ChinaMacedonia, FYRMadagascarMalawiMalaysiaMaldivesMaliMaltaMarshall IslandsMauritaniaMauritiusMexicoMicronesia, Fed. Sts.Middle East & North AfricaMiddle East & North Africa (excluding high income)Middle East & North Africa (IDA & IBRD countries)Middle incomeMoldovaMonacoMongoliaMontenegroMoroccoMozambiqueMyanmarNamibiaNepalNetherlandsNew CaledoniaNew ZealandNicaraguaNigerNigeriaNorth AmericaNorwayOECD membersOmanOther small statesPacific island small statesPakistanPalauPanamaPapua New GuineaParaguayPeruPhilippinesPolandPortugalPost-demographic dividendPre-demographic dividendPuerto RicoQatarRomaniaRussian FederationRwandaSamoaSan MarinoSao Tome and PrincipeSaudi ArabiaSenegalSerbiaSeychellesSierra LeoneSingaporeSint Maarten (Dutch part)Slovak RepublicSloveniaSmall statesSolomon IslandsSomaliaSouth AfricaSouth AsiaSouth Asia (IDA & IBRD)South SudanSpainSri LankaSt. Kitts and NevisSt. LuciaSt. Martin (French part)St. Vincent and the GrenadinesSub-Saharan Africa Sub-Saharan Africa (excluding high income)Sub-Saharan Africa (IDA & IBRD countries)SudanSurinameSwazilandSwedenSwitzerlandSyrian Arab RepublicTajikistanTanzaniaThailandTimor-LesteTogoTongaTrinidad and TobagoTunisiaTurkeyTurkmenistanUgandaUkraineUnited Arab EmiratesUnited KingdomUnited StatesUpper middle incomeUruguayUzbekistanVanuatuVenezuela, RBVietnamVirgin Islands (U.S.)West Bank and GazaWorldYemen, Rep.ZambiaZimbabwe Timeline:
This timeline shows a graph from 1961 to 2015 of Cabo Verde. No data until 1960. Number of actual observations by date: 55.
Source name:
World Development Indicators
Source organization:
(1) United Nations Population Division. World Population Prospects, (2) Census reports and other statistical publications from national statistical offices, (3) Eurostat: Demographic Statistics, (4) United Nations Statistical Division. Population and Vital Statistics Reprot (various years), (5) U.S. Census Bureau: International Database, and (6) Secretariat of the Pacific Community: Statistics and Demography Programme.
Categories, topics:
Health
Last updated:
apr 23, 2017
Indicators value changes by year
Minimum:
21.388
jan 1, 2015
Maximum:
48.011
jan 1, 1961
At the date of observation
Value
Absolute change
Change from previous value
jan 1, 1961
48.011
+48.011
0.0%
jan 1, 1962
47.645
-0.366
-0.76%
jan 1, 1963
47.169
-0.476
-1.0%
jan 1, 1964
46.586
-0.583
-1.24%
jan 1, 1965
45.911
-0.675
-1.45%
jan 1, 1966
45.167
-0.744
-1.62%
jan 1, 1967
44.383
-0.784
-1.74%
jan 1, 1968
43.599
-0.784
-1.77%
jan 1, 1969
42.855
-0.744
-1.71%
jan 1, 1970
42.181
-0.674
-1.57%
jan 1, 1971
41.604
-0.577
-1.37%
jan 1, 1972
41.14
-0.464
-1.12%
jan 1, 1973
40.782
-0.358
-0.87%
jan 1, 1974
40.524
-0.258
-0.63%
jan 1, 1975
40.367
-0.157
-0.39%
jan 1, 1976
40.316
-0.051
-0.13%
jan 1, 1977
40.376
+0.06
0.15%
jan 1, 1978
40.533
+0.157
0.39%
jan 1, 1979
40.763
+0.23
0.57%
jan 1, 1980
41.043
+0.28
0.69%
jan 1, 1981
41.356
+0.313
0.76%
jan 1, 1982
41.693
+0.337
0.81%
jan 1, 1983
42.03
+0.337
0.81%
jan 1, 1984
42.332
+0.302
0.72%
jan 1, 1985
42.558
+0.226
0.53%
jan 1, 1986
42.651
+0.093
0.22%
jan 1, 1987
42.56
-0.091
-0.21%
jan 1, 1988
42.264
-0.296
-0.7%
jan 1, 1989
41.758
-0.506
-1.2%
jan 1, 1990
41.045
-0.713
-1.71%
jan 1, 1991
40.147
-0.898
-2.19%
jan 1, 1992
39.097
-1.05
-2.62%
jan 1, 1993
37.952
-1.145
-2.93%
jan 1, 1994
36.761
-1.191
-3.14%
jan 1, 1995
35.556
-1.205
-3.28%
jan 1, 1996
34.349
-1.207
-3.39%
jan 1, 1997
33.132
-1.217
-3.54%
jan 1, 1998
31.896
-1.236
-3.73%
jan 1, 1999
30.644
-1.252
-3.93%
jan 1, 2000
29.4
-1.244
-4.06%
jan 1, 2001
28.198
-1.202
-4.09%
jan 1, 2002
27.075
-1.123
-3.98%
jan 1, 2003
26.057
-1.018
-3.76%
jan 1, 2004
25.162
-0.895
-3.43%
jan 1, 2005
24.402
-0.76
-3.02%
jan 1, 2006
23.783
-0.619
-2.54%
jan 1, 2007
23.303
-0.48
-2.02%
jan 1, 2008
22.935
-0.368
-1.58%
jan 1, 2009
22.645
-0.29
-1.26%
jan 1, 2010
22.413
-0.232
-1.02%
jan 1, 2011
22.212
-0.201
-0.9%
jan 1, 2012
22.023
-0.189
-0.85%
jan 1, 2013
21.832
-0.191
-0.87%
jan 1, 2014
21.625
-0.207
-0.95%
jan 1, 2015
21.388
-0.237
-1.1%
Ranking of countries by current statistics by years


Comments: