29
/
en
AIzaSyAYiBZKx7MnpbEhh9jyipgxe19OcubqV5w
April 1, 2024
251661
St. Vincent and the Grenadines
VCT
true
2
1
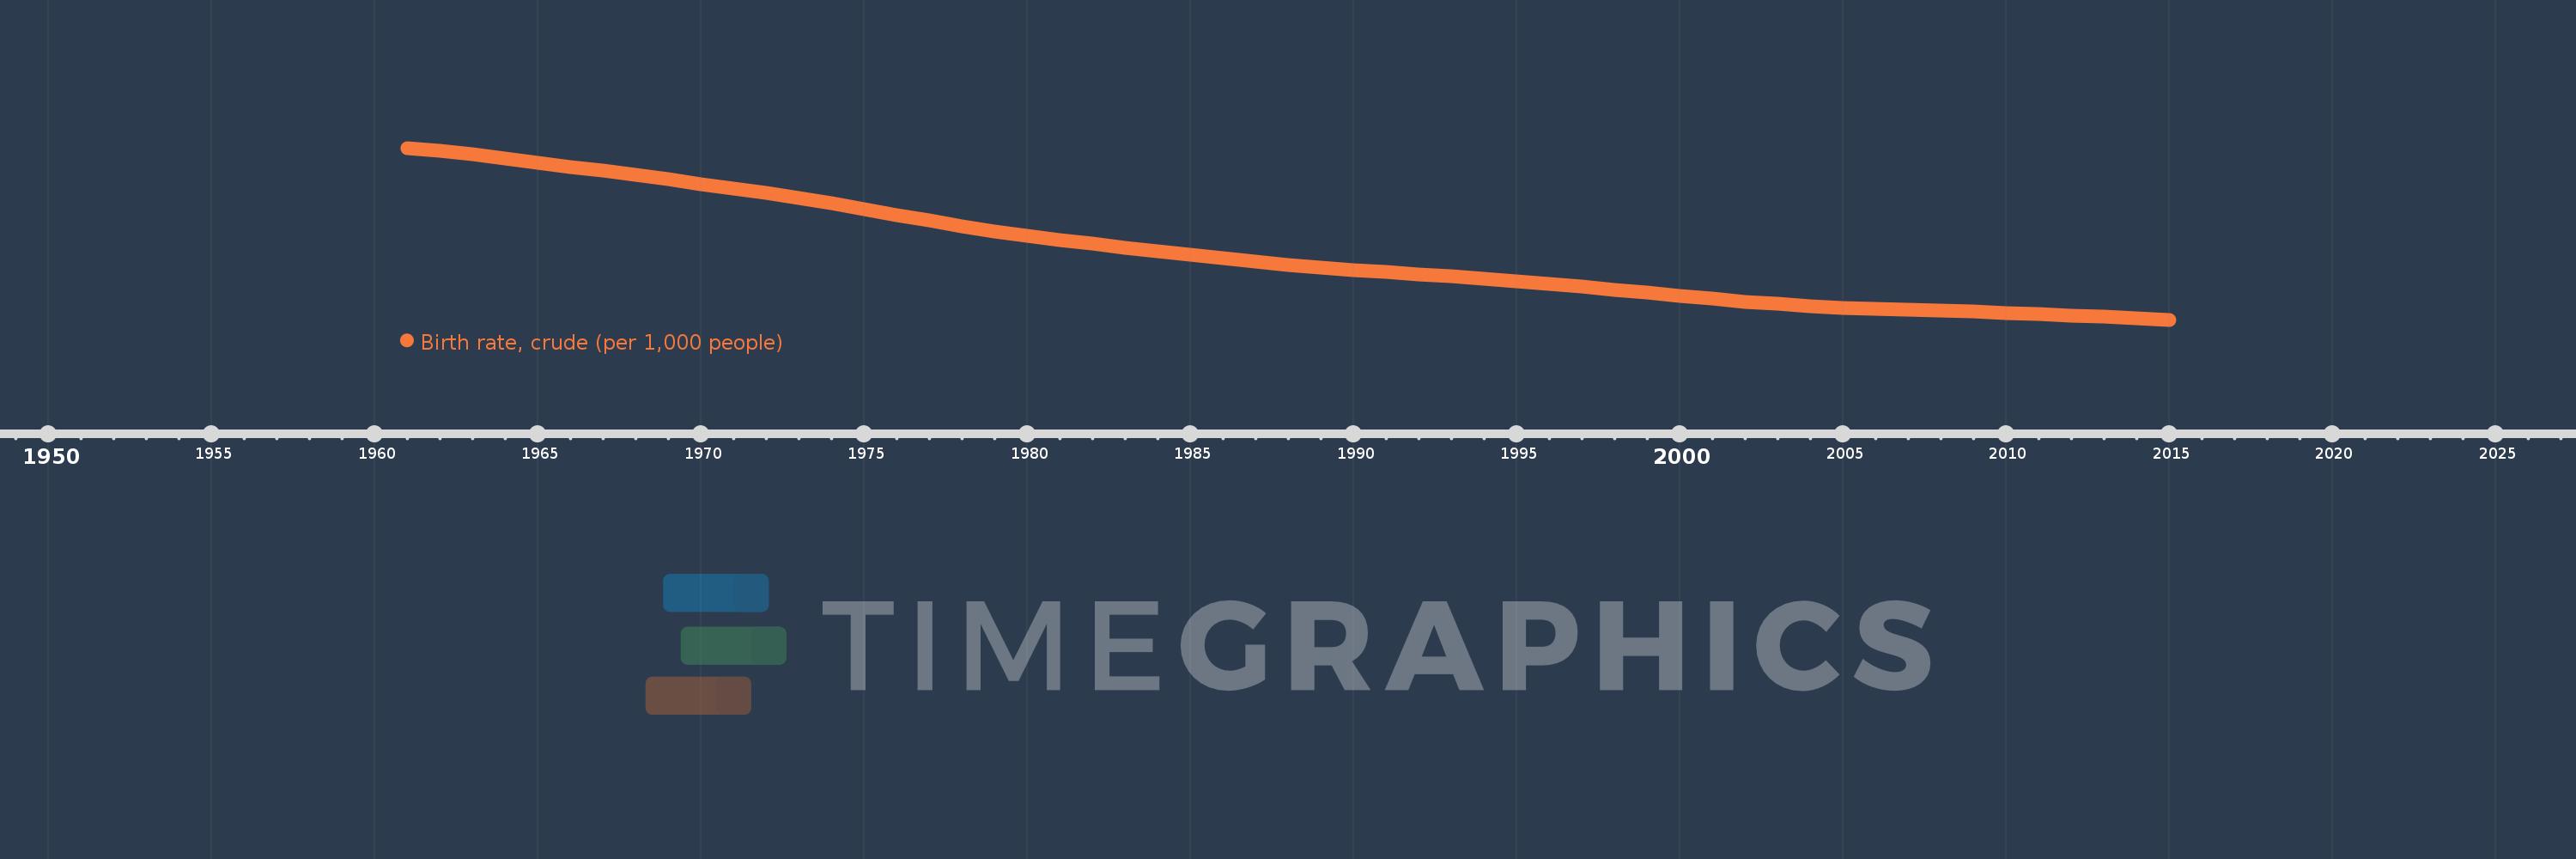
Birth rate, crude (per 1,000 people)
2015,2014,2013,2012,2011,2010,2009,2008,2007,2006,2005,2004,2003,2002,2001,2000,1999,1998,1997,1996,1995,1994,1993,1992,1991,1990,1989,1988,1987,1986,1985,1984,1983,1982,1981,1980,1979,1978,1977,1976,1975,1974,1973,1972,1971,1970,1969,1968,1967,1966,1965,1964,1963,1962,1961
This statistics in other country:
AfghanistanAlbaniaAlgeriaAmerican SamoaAndorraAngolaAntigua and BarbudaArab WorldArgentinaArmeniaArubaAustraliaAustriaAzerbaijanBahamas, TheBahrainBangladeshBarbadosBelarusBelgiumBelizeBeninBermudaBhutanBoliviaBosnia and HerzegovinaBotswanaBrazilBrunei DarussalamBulgariaBurkina FasoBurundiCabo VerdeCambodiaCameroonCanadaCaribbean small statesCayman IslandsCentral African RepublicCentral Europe and the BalticsChadChannel IslandsChileChinaColombiaComorosCongo, Dem. Rep.Congo, Rep.Costa RicaCote d'IvoireCroatiaCubaCuracaoCyprusCzech RepublicDenmarkDjiboutiDominicaDominican RepublicEarly-demographic dividendEast Asia & PacificEast Asia & Pacific (excluding high income)East Asia & Pacific (IDA & IBRD countries)EcuadorEgypt, Arab Rep.El SalvadorEquatorial GuineaEritreaEstoniaEthiopiaEuro areaEurope & Central AsiaEurope & Central Asia (excluding high income)Europe & Central Asia (IDA & IBRD countries)European UnionFaroe IslandsFijiFinlandFragile and conflict affected situationsFranceFrench PolynesiaGabonGambia, TheGeorgiaGermanyGhanaGreeceGreenlandGrenadaGuamGuatemalaGuineaGuinea-BissauGuyanaHaitiHeavily indebted poor countries (HIPC)High incomeHondurasHong Kong SAR, ChinaHungaryIBRD onlyIcelandIDA & IBRD totalIDA blendIDA onlyIDA totalIndiaIndonesiaIran, Islamic Rep.IraqIrelandIsle of ManIsraelItalyJamaicaJapanJordanKazakhstanKenyaKiribatiKorea, Dem. People’s Rep.Korea, Rep.KosovoKuwaitKyrgyz RepublicLao PDRLate-demographic dividendLatin America & Caribbean Latin America & Caribbean (excluding high income)Latin America & the Caribbean (IDA & IBRD countries)LatviaLeast developed countries: UN classificationLebanonLesothoLiberiaLibyaLiechtensteinLithuaniaLow & middle incomeLow incomeLower middle incomeLuxembourgMacao SAR, ChinaMacedonia, FYRMadagascarMalawiMalaysiaMaldivesMaliMaltaMarshall IslandsMauritaniaMauritiusMexicoMicronesia, Fed. Sts.Middle East & North AfricaMiddle East & North Africa (excluding high income)Middle East & North Africa (IDA & IBRD countries)Middle incomeMoldovaMonacoMongoliaMontenegroMoroccoMozambiqueMyanmarNamibiaNepalNetherlandsNew CaledoniaNew ZealandNicaraguaNigerNigeriaNorth AmericaNorwayOECD membersOmanOther small statesPacific island small statesPakistanPalauPanamaPapua New GuineaParaguayPeruPhilippinesPolandPortugalPost-demographic dividendPre-demographic dividendPuerto RicoQatarRomaniaRussian FederationRwandaSamoaSan MarinoSao Tome and PrincipeSaudi ArabiaSenegalSerbiaSeychellesSierra LeoneSingaporeSint Maarten (Dutch part)Slovak RepublicSloveniaSmall statesSolomon IslandsSomaliaSouth AfricaSouth AsiaSouth Asia (IDA & IBRD)South SudanSpainSri LankaSt. Kitts and NevisSt. LuciaSt. Martin (French part)St. Vincent and the GrenadinesSub-Saharan Africa Sub-Saharan Africa (excluding high income)Sub-Saharan Africa (IDA & IBRD countries)SudanSurinameSwazilandSwedenSwitzerlandSyrian Arab RepublicTajikistanTanzaniaThailandTimor-LesteTogoTongaTrinidad and TobagoTunisiaTurkeyTurkmenistanUgandaUkraineUnited Arab EmiratesUnited KingdomUnited StatesUpper middle incomeUruguayUzbekistanVanuatuVenezuela, RBVietnamVirgin Islands (U.S.)West Bank and GazaWorldYemen, Rep.ZambiaZimbabwe Timeline:
This timeline shows a graph from 1961 to 2015 of St. Vincent and the Grenadines. No data until 1960. Number of actual observations by date: 55.
Source name:
World Development Indicators
Source organization:
(1) United Nations Population Division. World Population Prospects, (2) Census reports and other statistical publications from national statistical offices, (3) Eurostat: Demographic Statistics, (4) United Nations Statistical Division. Population and Vital Statistics Reprot (various years), (5) U.S. Census Bureau: International Database, and (6) Secretariat of the Pacific Community: Statistics and Demography Programme.
Categories, topics:
Health
Last updated:
apr 23, 2017
Indicators value changes by year
Maximum:
47.877
jan 1, 1961
At the date of observation
Value
Absolute change
Change from previous value
jan 1, 1961
47.877
+47.877
0.0%
jan 1, 1962
47.296
-0.581
-1.21%
jan 1, 1963
46.647
-0.649
-1.37%
jan 1, 1964
45.939
-0.708
-1.52%
jan 1, 1965
45.187
-0.752
-1.64%
jan 1, 1966
44.406
-0.781
-1.73%
jan 1, 1967
43.614
-0.792
-1.78%
jan 1, 1968
42.818
-0.796
-1.83%
jan 1, 1969
42.019
-0.799
-1.87%
jan 1, 1970
41.218
-0.801
-1.91%
jan 1, 1971
40.395
-0.823
-2.0%
jan 1, 1972
39.527
-0.868
-2.15%
jan 1, 1973
38.595
-0.932
-2.36%
jan 1, 1974
37.599
-0.996
-2.58%
jan 1, 1975
36.55
-1.049
-2.79%
jan 1, 1976
35.477
-1.073
-2.94%
jan 1, 1977
34.417
-1.06
-2.99%
jan 1, 1978
33.405
-1.012
-2.94%
jan 1, 1979
32.466
-0.939
-2.81%
jan 1, 1980
31.612
-0.854
-2.63%
jan 1, 1981
30.835
-0.777
-2.46%
jan 1, 1982
30.115
-0.72
-2.34%
jan 1, 1983
29.422
-0.693
-2.3%
jan 1, 1984
28.737
-0.685
-2.33%
jan 1, 1985
28.056
-0.681
-2.37%
jan 1, 1986
27.392
-0.664
-2.37%
jan 1, 1987
26.765
-0.627
-2.29%
jan 1, 1988
26.195
-0.57
-2.13%
jan 1, 1989
25.689
-0.506
-1.93%
jan 1, 1990
25.242
-0.447
-1.74%
jan 1, 1991
24.84
-0.402
-1.59%
jan 1, 1992
24.46
-0.38
-1.53%
jan 1, 1993
24.078
-0.382
-1.56%
jan 1, 1994
23.673
-0.405
-1.68%
jan 1, 1995
23.233
-0.44
-1.86%
jan 1, 1996
22.749
-0.484
-2.08%
jan 1, 1997
22.214
-0.535
-2.35%
jan 1, 1998
21.643
-0.571
-2.57%
jan 1, 1999
21.055
-0.588
-2.72%
jan 1, 2000
20.466
-0.589
-2.8%
jan 1, 2001
19.902
-0.564
-2.76%
jan 1, 2002
19.39
-0.512
-2.57%
jan 1, 2003
18.948
-0.442
-2.28%
jan 1, 2004
18.581
-0.367
-1.94%
jan 1, 2005
18.29
-0.291
-1.57%
jan 1, 2006
18.062
-0.228
-1.25%
jan 1, 2007
17.877
-0.185
-1.02%
jan 1, 2008
17.706
-0.171
-0.96%
jan 1, 2009
17.525
-0.181
-1.02%
jan 1, 2010
17.323
-0.202
-1.15%
jan 1, 2011
17.093
-0.23
-1.33%
jan 1, 2012
16.84
-0.253
-1.48%
jan 1, 2013
16.574
-0.266
-1.58%
jan 1, 2014
16.306
-0.268
-1.62%
jan 1, 2015
16.04
-0.266
-1.63%
Ranking of countries by current statistics by years


Comments: