29
/
en
AIzaSyAYiBZKx7MnpbEhh9jyipgxe19OcubqV5w
April 1, 2024
34783
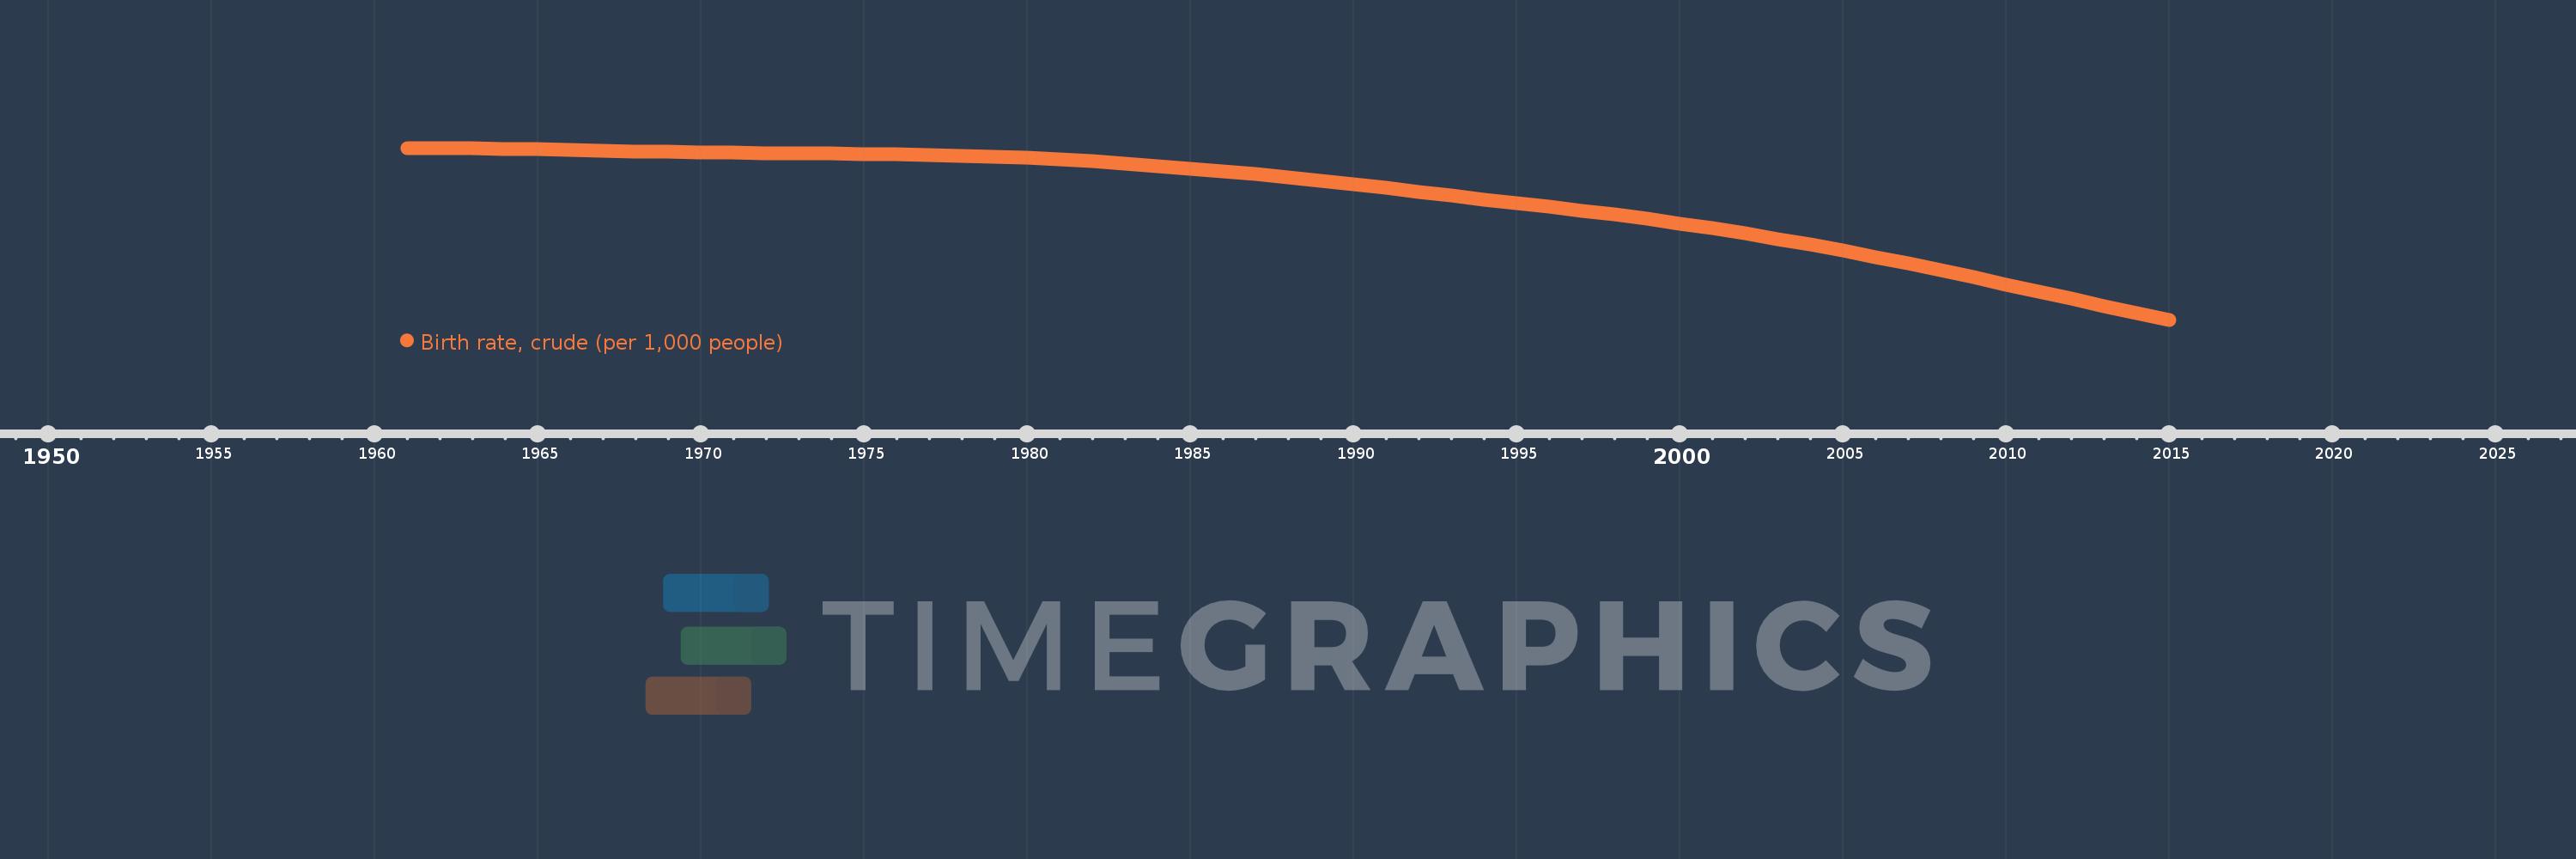
Heavily indebted poor countries (HIPC)
HPC
false
2
1
Birth rate, crude (per 1,000 people)
2015,2014,2013,2012,2011,2010,2009,2008,2007,2006,2005,2004,2003,2002,2001,2000,1999,1998,1997,1996,1995,1994,1993,1992,1991,1990,1989,1988,1987,1986,1985,1984,1983,1982,1981,1980,1979,1978,1977,1976,1975,1974,1973,1972,1971,1970,1969,1968,1967,1966,1965,1964,1963,1962,1961
This statistics in other country:
AfghanistanAlbaniaAlgeriaAmerican SamoaAndorraAngolaAntigua and BarbudaArab WorldArgentinaArmeniaArubaAustraliaAustriaAzerbaijanBahamas, TheBahrainBangladeshBarbadosBelarusBelgiumBelizeBeninBermudaBhutanBoliviaBosnia and HerzegovinaBotswanaBrazilBrunei DarussalamBulgariaBurkina FasoBurundiCabo VerdeCambodiaCameroonCanadaCaribbean small statesCayman IslandsCentral African RepublicCentral Europe and the BalticsChadChannel IslandsChileChinaColombiaComorosCongo, Dem. Rep.Congo, Rep.Costa RicaCote d'IvoireCroatiaCubaCuracaoCyprusCzech RepublicDenmarkDjiboutiDominicaDominican RepublicEarly-demographic dividendEast Asia & PacificEast Asia & Pacific (excluding high income)East Asia & Pacific (IDA & IBRD countries)EcuadorEgypt, Arab Rep.El SalvadorEquatorial GuineaEritreaEstoniaEthiopiaEuro areaEurope & Central AsiaEurope & Central Asia (excluding high income)Europe & Central Asia (IDA & IBRD countries)European UnionFaroe IslandsFijiFinlandFragile and conflict affected situationsFranceFrench PolynesiaGabonGambia, TheGeorgiaGermanyGhanaGreeceGreenlandGrenadaGuamGuatemalaGuineaGuinea-BissauGuyanaHaitiHeavily indebted poor countries (HIPC)High incomeHondurasHong Kong SAR, ChinaHungaryIBRD onlyIcelandIDA & IBRD totalIDA blendIDA onlyIDA totalIndiaIndonesiaIran, Islamic Rep.IraqIrelandIsle of ManIsraelItalyJamaicaJapanJordanKazakhstanKenyaKiribatiKorea, Dem. People’s Rep.Korea, Rep.KosovoKuwaitKyrgyz RepublicLao PDRLate-demographic dividendLatin America & Caribbean Latin America & Caribbean (excluding high income)Latin America & the Caribbean (IDA & IBRD countries)LatviaLeast developed countries: UN classificationLebanonLesothoLiberiaLibyaLiechtensteinLithuaniaLow & middle incomeLow incomeLower middle incomeLuxembourgMacao SAR, ChinaMacedonia, FYRMadagascarMalawiMalaysiaMaldivesMaliMaltaMarshall IslandsMauritaniaMauritiusMexicoMicronesia, Fed. Sts.Middle East & North AfricaMiddle East & North Africa (excluding high income)Middle East & North Africa (IDA & IBRD countries)Middle incomeMoldovaMonacoMongoliaMontenegroMoroccoMozambiqueMyanmarNamibiaNepalNetherlandsNew CaledoniaNew ZealandNicaraguaNigerNigeriaNorth AmericaNorwayOECD membersOmanOther small statesPacific island small statesPakistanPalauPanamaPapua New GuineaParaguayPeruPhilippinesPolandPortugalPost-demographic dividendPre-demographic dividendPuerto RicoQatarRomaniaRussian FederationRwandaSamoaSan MarinoSao Tome and PrincipeSaudi ArabiaSenegalSerbiaSeychellesSierra LeoneSingaporeSint Maarten (Dutch part)Slovak RepublicSloveniaSmall statesSolomon IslandsSomaliaSouth AfricaSouth AsiaSouth Asia (IDA & IBRD)South SudanSpainSri LankaSt. Kitts and NevisSt. LuciaSt. Martin (French part)St. Vincent and the GrenadinesSub-Saharan Africa Sub-Saharan Africa (excluding high income)Sub-Saharan Africa (IDA & IBRD countries)SudanSurinameSwazilandSwedenSwitzerlandSyrian Arab RepublicTajikistanTanzaniaThailandTimor-LesteTogoTongaTrinidad and TobagoTunisiaTurkeyTurkmenistanUgandaUkraineUnited Arab EmiratesUnited KingdomUnited StatesUpper middle incomeUruguayUzbekistanVanuatuVenezuela, RBVietnamVirgin Islands (U.S.)West Bank and GazaWorldYemen, Rep.ZambiaZimbabwe Timeline:
This timeline shows a graph from 1961 to 2015 of Heavily indebted poor countries (HIPC). No data until 1960. Number of actual observations by date: 55.
Source name:
World Development Indicators
Source organization:
(1) United Nations Population Division. World Population Prospects, (2) Census reports and other statistical publications from national statistical offices, (3) Eurostat: Demographic Statistics, (4) United Nations Statistical Division. Population and Vital Statistics Reprot (various years), (5) U.S. Census Bureau: International Database, and (6) Secretariat of the Pacific Community: Statistics and Demography Programme.
Categories, topics:
Health
Last updated:
apr 23, 2017
Indicators value changes by year
Maximum:
48.181
jan 1, 1961
At the date of observation
Value
Absolute change
Change from previous value
jan 1, 1961
48.181
+48.181
0.0%
jan 1, 1962
48.17
-0.011
-0.02%
jan 1, 1963
48.152
-0.018
-0.04%
jan 1, 1964
48.126
-0.026
-0.05%
jan 1, 1965
48.092
-0.034
-0.07%
jan 1, 1966
48.051
-0.041
-0.08%
jan 1, 1967
48.007
-0.044
-0.09%
jan 1, 1968
47.964
-0.043
-0.09%
jan 1, 1969
47.925
-0.039
-0.08%
jan 1, 1970
47.891
-0.034
-0.07%
jan 1, 1971
47.864
-0.026
-0.06%
jan 1, 1972
47.846
-0.019
-0.04%
jan 1, 1973
47.832
-0.014
-0.03%
jan 1, 1974
47.817
-0.014
-0.03%
jan 1, 1975
47.799
-0.018
-0.04%
jan 1, 1976
47.773
-0.026
-0.06%
jan 1, 1977
47.735
-0.038
-0.08%
jan 1, 1978
47.684
-0.051
-0.11%
jan 1, 1979
47.617
-0.067
-0.14%
jan 1, 1980
47.532
-0.085
-0.18%
jan 1, 1981
47.428
-0.104
-0.22%
jan 1, 1982
47.306
-0.122
-0.26%
jan 1, 1983
47.167
-0.139
-0.29%
jan 1, 1984
47.014
-0.153
-0.32%
jan 1, 1985
46.849
-0.165
-0.35%
jan 1, 1986
46.672
-0.177
-0.38%
jan 1, 1987
46.483
-0.19
-0.41%
jan 1, 1988
46.279
-0.204
-0.44%
jan 1, 1989
46.059
-0.22
-0.47%
jan 1, 1990
45.823
-0.237
-0.51%
jan 1, 1991
45.573
-0.249
-0.54%
jan 1, 1992
45.32
-0.253
-0.56%
jan 1, 1993
45.07
-0.25
-0.55%
jan 1, 1994
44.826
-0.244
-0.54%
jan 1, 1995
44.587
-0.239
-0.53%
jan 1, 1996
44.347
-0.24
-0.54%
jan 1, 1997
44.101
-0.246
-0.56%
jan 1, 1998
43.842
-0.259
-0.59%
jan 1, 1999
43.565
-0.277
-0.63%
jan 1, 2000
43.269
-0.296
-0.68%
jan 1, 2001
42.953
-0.316
-0.73%
jan 1, 2002
42.617
-0.336
-0.78%
jan 1, 2003
42.262
-0.355
-0.83%
jan 1, 2004
41.889
-0.373
-0.88%
jan 1, 2005
41.498
-0.391
-0.93%
jan 1, 2006
41.089
-0.409
-0.99%
jan 1, 2007
40.662
-0.427
-1.04%
jan 1, 2008
40.22
-0.442
-1.09%
jan 1, 2009
39.766
-0.454
-1.13%
jan 1, 2010
39.305
-0.461
-1.16%
jan 1, 2011
38.842
-0.463
-1.18%
jan 1, 2012
38.379
-0.463
-1.19%
jan 1, 2013
37.92
-0.459
-1.2%
jan 1, 2014
37.466
-0.454
-1.2%
jan 1, 2015
37.02
-0.446
-1.19%
Ranking of countries by current statistics by years


Comments: