29
/
en
AIzaSyAYiBZKx7MnpbEhh9jyipgxe19OcubqV5w
April 1, 2024
196501
Micronesia, Fed. Sts.
FSM
true
2
1
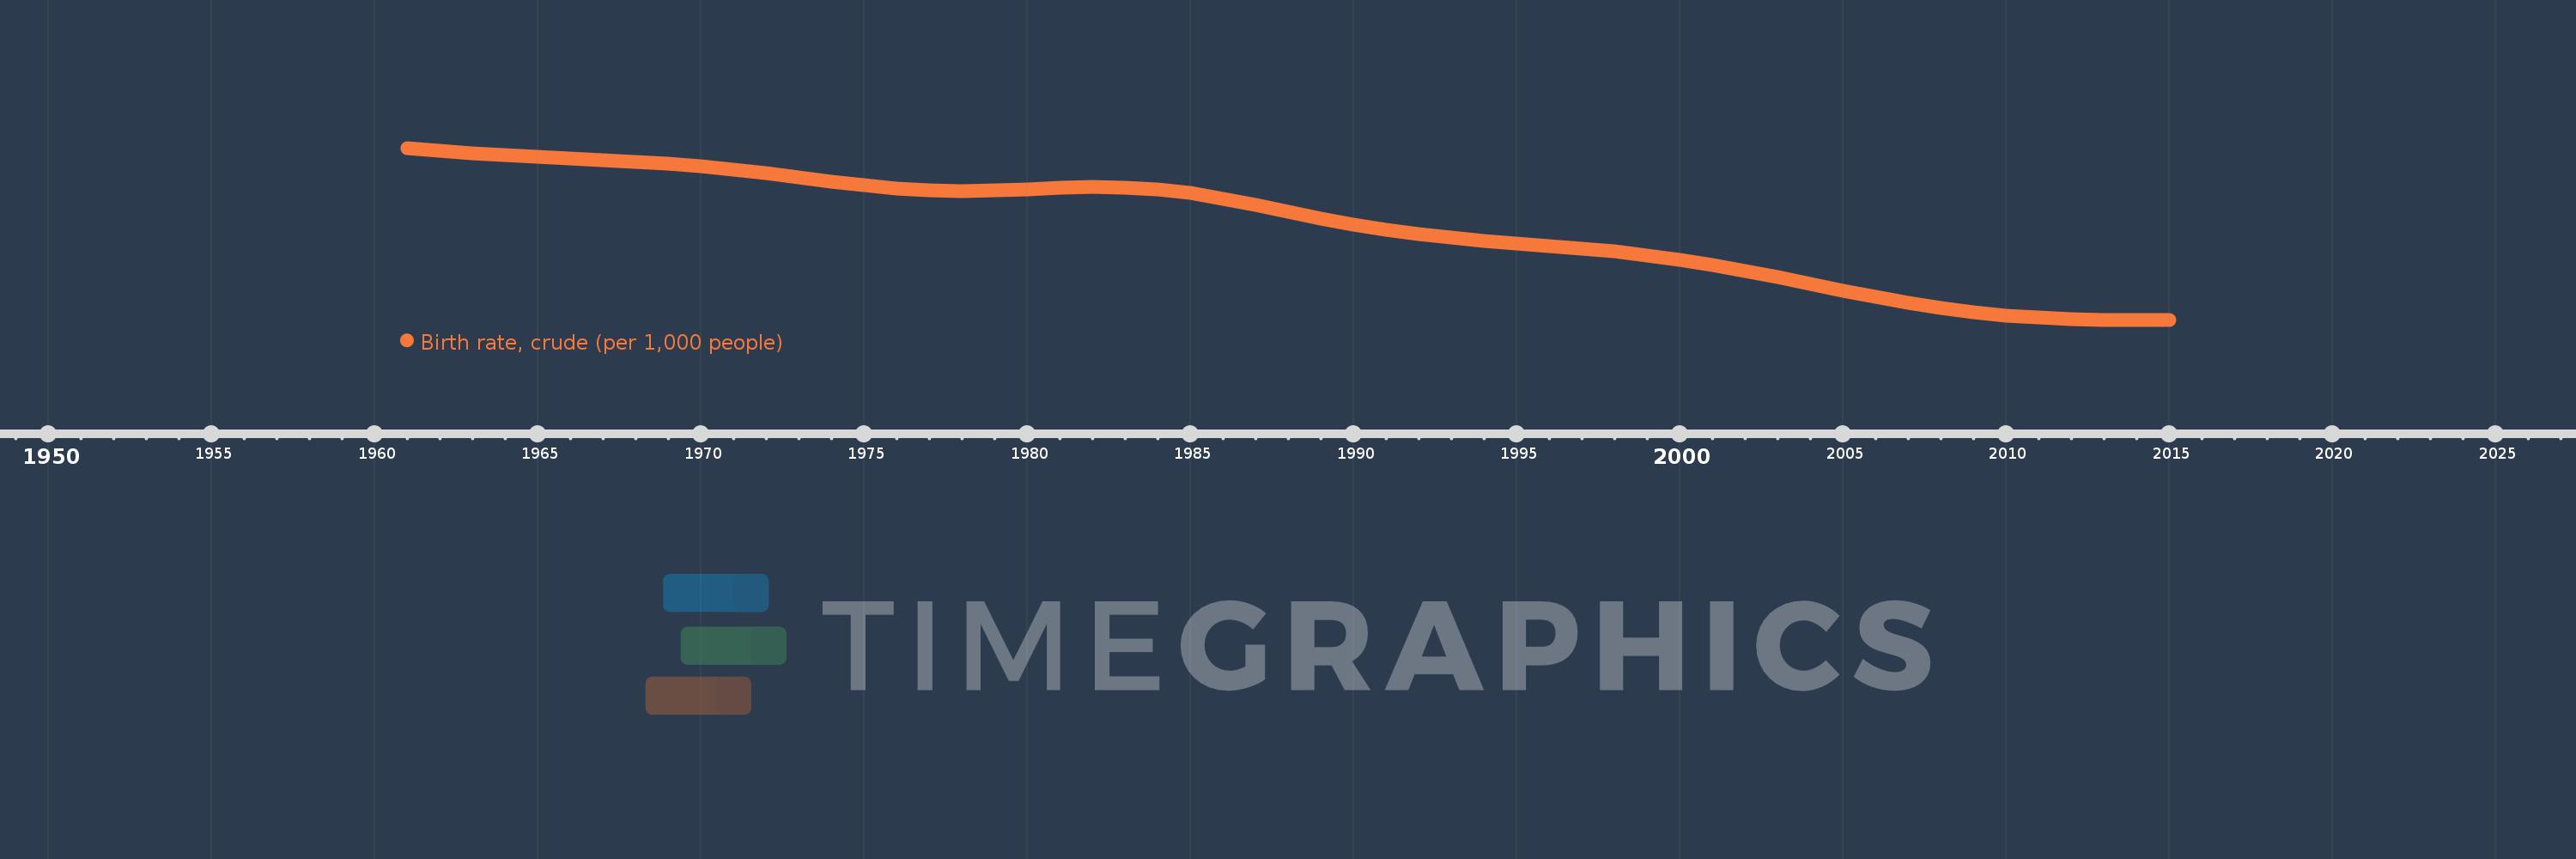
Birth rate, crude (per 1,000 people)
2015,2014,2013,2012,2011,2010,2009,2008,2007,2006,2005,2004,2003,2002,2001,2000,1999,1998,1997,1996,1995,1994,1993,1992,1991,1990,1989,1988,1987,1986,1985,1984,1983,1982,1981,1980,1979,1978,1977,1976,1975,1974,1973,1972,1971,1970,1969,1968,1967,1966,1965,1964,1963,1962,1961
This statistics in other country:
AfghanistanAlbaniaAlgeriaAmerican SamoaAndorraAngolaAntigua and BarbudaArab WorldArgentinaArmeniaArubaAustraliaAustriaAzerbaijanBahamas, TheBahrainBangladeshBarbadosBelarusBelgiumBelizeBeninBermudaBhutanBoliviaBosnia and HerzegovinaBotswanaBrazilBrunei DarussalamBulgariaBurkina FasoBurundiCabo VerdeCambodiaCameroonCanadaCaribbean small statesCayman IslandsCentral African RepublicCentral Europe and the BalticsChadChannel IslandsChileChinaColombiaComorosCongo, Dem. Rep.Congo, Rep.Costa RicaCote d'IvoireCroatiaCubaCuracaoCyprusCzech RepublicDenmarkDjiboutiDominicaDominican RepublicEarly-demographic dividendEast Asia & PacificEast Asia & Pacific (excluding high income)East Asia & Pacific (IDA & IBRD countries)EcuadorEgypt, Arab Rep.El SalvadorEquatorial GuineaEritreaEstoniaEthiopiaEuro areaEurope & Central AsiaEurope & Central Asia (excluding high income)Europe & Central Asia (IDA & IBRD countries)European UnionFaroe IslandsFijiFinlandFragile and conflict affected situationsFranceFrench PolynesiaGabonGambia, TheGeorgiaGermanyGhanaGreeceGreenlandGrenadaGuamGuatemalaGuineaGuinea-BissauGuyanaHaitiHeavily indebted poor countries (HIPC)High incomeHondurasHong Kong SAR, ChinaHungaryIBRD onlyIcelandIDA & IBRD totalIDA blendIDA onlyIDA totalIndiaIndonesiaIran, Islamic Rep.IraqIrelandIsle of ManIsraelItalyJamaicaJapanJordanKazakhstanKenyaKiribatiKorea, Dem. People’s Rep.Korea, Rep.KosovoKuwaitKyrgyz RepublicLao PDRLate-demographic dividendLatin America & Caribbean Latin America & Caribbean (excluding high income)Latin America & the Caribbean (IDA & IBRD countries)LatviaLeast developed countries: UN classificationLebanonLesothoLiberiaLibyaLiechtensteinLithuaniaLow & middle incomeLow incomeLower middle incomeLuxembourgMacao SAR, ChinaMacedonia, FYRMadagascarMalawiMalaysiaMaldivesMaliMaltaMarshall IslandsMauritaniaMauritiusMexicoMicronesia, Fed. Sts.Middle East & North AfricaMiddle East & North Africa (excluding high income)Middle East & North Africa (IDA & IBRD countries)Middle incomeMoldovaMonacoMongoliaMontenegroMoroccoMozambiqueMyanmarNamibiaNepalNetherlandsNew CaledoniaNew ZealandNicaraguaNigerNigeriaNorth AmericaNorwayOECD membersOmanOther small statesPacific island small statesPakistanPalauPanamaPapua New GuineaParaguayPeruPhilippinesPolandPortugalPost-demographic dividendPre-demographic dividendPuerto RicoQatarRomaniaRussian FederationRwandaSamoaSan MarinoSao Tome and PrincipeSaudi ArabiaSenegalSerbiaSeychellesSierra LeoneSingaporeSint Maarten (Dutch part)Slovak RepublicSloveniaSmall statesSolomon IslandsSomaliaSouth AfricaSouth AsiaSouth Asia (IDA & IBRD)South SudanSpainSri LankaSt. Kitts and NevisSt. LuciaSt. Martin (French part)St. Vincent and the GrenadinesSub-Saharan Africa Sub-Saharan Africa (excluding high income)Sub-Saharan Africa (IDA & IBRD countries)SudanSurinameSwazilandSwedenSwitzerlandSyrian Arab RepublicTajikistanTanzaniaThailandTimor-LesteTogoTongaTrinidad and TobagoTunisiaTurkeyTurkmenistanUgandaUkraineUnited Arab EmiratesUnited KingdomUnited StatesUpper middle incomeUruguayUzbekistanVanuatuVenezuela, RBVietnamVirgin Islands (U.S.)West Bank and GazaWorldYemen, Rep.ZambiaZimbabwe Timeline:
This timeline shows a graph from 1961 to 2015 of Micronesia, Fed. Sts.. No data until 1960. Number of actual observations by date: 55.
Source name:
World Development Indicators
Source organization:
(1) United Nations Population Division. World Population Prospects, (2) Census reports and other statistical publications from national statistical offices, (3) Eurostat: Demographic Statistics, (4) United Nations Statistical Division. Population and Vital Statistics Reprot (various years), (5) U.S. Census Bureau: International Database, and (6) Secretariat of the Pacific Community: Statistics and Demography Programme.
Categories, topics:
Health
Last updated:
apr 23, 2017
Indicators value changes by year
Minimum:
23.511
jan 1, 2014
Maximum:
43.567
jan 1, 1961
At the date of observation
Value
Absolute change
Change from previous value
jan 1, 1961
43.567
+43.567
0.0%
jan 1, 1962
43.218
-0.349
-0.8%
jan 1, 1963
42.933
-0.285
-0.66%
jan 1, 1964
42.706
-0.227
-0.53%
jan 1, 1965
42.523
-0.183
-0.43%
jan 1, 1966
42.357
-0.166
-0.39%
jan 1, 1967
42.18
-0.177
-0.42%
jan 1, 1968
41.968
-0.212
-0.5%
jan 1, 1969
41.707
-0.261
-0.62%
jan 1, 1970
41.391
-0.316
-0.76%
jan 1, 1971
41.016
-0.375
-0.91%
jan 1, 1972
40.585
-0.431
-1.05%
jan 1, 1973
40.123
-0.462
-1.14%
jan 1, 1974
39.66
-0.463
-1.15%
jan 1, 1975
39.222
-0.438
-1.1%
jan 1, 1976
38.861
-0.361
-0.92%
jan 1, 1977
38.63
-0.231
-0.59%
jan 1, 1978
38.543
-0.087
-0.23%
jan 1, 1979
38.588
+0.045
0.12%
jan 1, 1980
38.732
+0.144
0.37%
jan 1, 1981
38.902
+0.17
0.44%
jan 1, 1982
39.005
+0.103
0.26%
jan 1, 1983
38.963
-0.042
-0.11%
jan 1, 1984
38.728
-0.235
-0.6%
jan 1, 1985
38.289
-0.439
-1.13%
jan 1, 1986
37.666
-0.623
-1.63%
jan 1, 1987
36.91
-0.756
-2.01%
jan 1, 1988
36.106
-0.804
-2.18%
jan 1, 1989
35.329
-0.777
-2.15%
jan 1, 1990
34.617
-0.712
-2.02%
jan 1, 1991
34.004
-0.613
-1.77%
jan 1, 1992
33.505
-0.499
-1.47%
jan 1, 1993
33.096
-0.409
-1.22%
jan 1, 1994
32.748
-0.348
-1.05%
jan 1, 1995
32.443
-0.305
-0.93%
jan 1, 1996
32.149
-0.294
-0.91%
jan 1, 1997
31.834
-0.315
-0.98%
jan 1, 1998
31.467
-0.367
-1.15%
jan 1, 1999
31.03
-0.437
-1.39%
jan 1, 2000
30.513
-0.517
-1.67%
jan 1, 2001
29.906
-0.607
-1.99%
jan 1, 2002
29.21
-0.696
-2.33%
jan 1, 2003
28.453
-0.757
-2.59%
jan 1, 2004
27.669
-0.784
-2.76%
jan 1, 2005
26.886
-0.783
-2.83%
jan 1, 2006
26.139
-0.747
-2.78%
jan 1, 2007
25.461
-0.678
-2.59%
jan 1, 2008
24.872
-0.589
-2.31%
jan 1, 2009
24.385
-0.487
-1.96%
jan 1, 2010
24.011
-0.374
-1.53%
jan 1, 2011
23.751
-0.26
-1.08%
jan 1, 2012
23.598
-0.153
-0.64%
jan 1, 2013
23.528
-0.07
-0.3%
jan 1, 2014
23.511
-0.017
-0.07%
jan 1, 2015
23.531
+0.02
0.09%
Ranking of countries by current statistics by years


Comments: