29
/
en
AIzaSyAYiBZKx7MnpbEhh9jyipgxe19OcubqV5w
April 1, 2024
215040
Oman
OMN
true
2
1
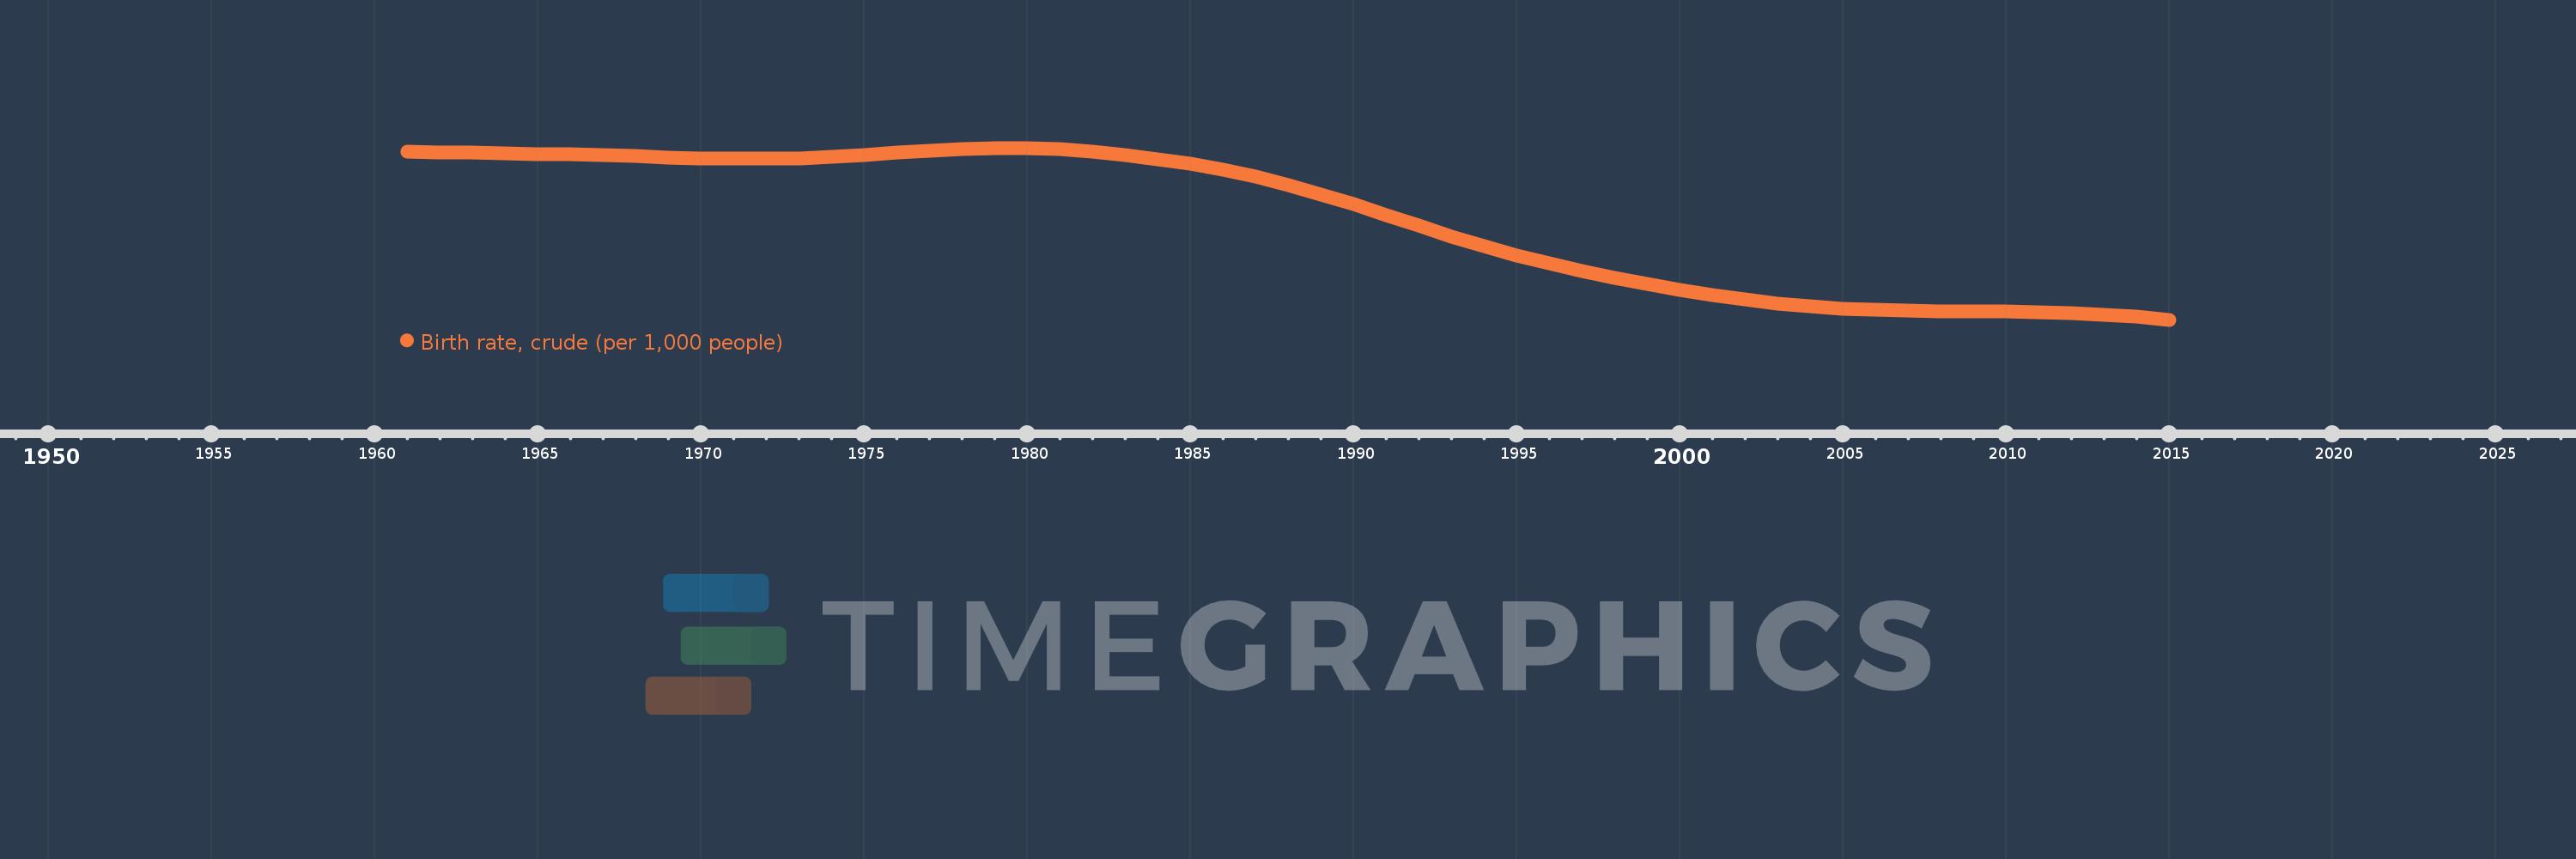
Birth rate, crude (per 1,000 people)
2015,2014,2013,2012,2011,2010,2009,2008,2007,2006,2005,2004,2003,2002,2001,2000,1999,1998,1997,1996,1995,1994,1993,1992,1991,1990,1989,1988,1987,1986,1985,1984,1983,1982,1981,1980,1979,1978,1977,1976,1975,1974,1973,1972,1971,1970,1969,1968,1967,1966,1965,1964,1963,1962,1961
This statistics in other country:
AfghanistanAlbaniaAlgeriaAmerican SamoaAndorraAngolaAntigua and BarbudaArab WorldArgentinaArmeniaArubaAustraliaAustriaAzerbaijanBahamas, TheBahrainBangladeshBarbadosBelarusBelgiumBelizeBeninBermudaBhutanBoliviaBosnia and HerzegovinaBotswanaBrazilBrunei DarussalamBulgariaBurkina FasoBurundiCabo VerdeCambodiaCameroonCanadaCaribbean small statesCayman IslandsCentral African RepublicCentral Europe and the BalticsChadChannel IslandsChileChinaColombiaComorosCongo, Dem. Rep.Congo, Rep.Costa RicaCote d'IvoireCroatiaCubaCuracaoCyprusCzech RepublicDenmarkDjiboutiDominicaDominican RepublicEarly-demographic dividendEast Asia & PacificEast Asia & Pacific (excluding high income)East Asia & Pacific (IDA & IBRD countries)EcuadorEgypt, Arab Rep.El SalvadorEquatorial GuineaEritreaEstoniaEthiopiaEuro areaEurope & Central AsiaEurope & Central Asia (excluding high income)Europe & Central Asia (IDA & IBRD countries)European UnionFaroe IslandsFijiFinlandFragile and conflict affected situationsFranceFrench PolynesiaGabonGambia, TheGeorgiaGermanyGhanaGreeceGreenlandGrenadaGuamGuatemalaGuineaGuinea-BissauGuyanaHaitiHeavily indebted poor countries (HIPC)High incomeHondurasHong Kong SAR, ChinaHungaryIBRD onlyIcelandIDA & IBRD totalIDA blendIDA onlyIDA totalIndiaIndonesiaIran, Islamic Rep.IraqIrelandIsle of ManIsraelItalyJamaicaJapanJordanKazakhstanKenyaKiribatiKorea, Dem. People’s Rep.Korea, Rep.KosovoKuwaitKyrgyz RepublicLao PDRLate-demographic dividendLatin America & Caribbean Latin America & Caribbean (excluding high income)Latin America & the Caribbean (IDA & IBRD countries)LatviaLeast developed countries: UN classificationLebanonLesothoLiberiaLibyaLiechtensteinLithuaniaLow & middle incomeLow incomeLower middle incomeLuxembourgMacao SAR, ChinaMacedonia, FYRMadagascarMalawiMalaysiaMaldivesMaliMaltaMarshall IslandsMauritaniaMauritiusMexicoMicronesia, Fed. Sts.Middle East & North AfricaMiddle East & North Africa (excluding high income)Middle East & North Africa (IDA & IBRD countries)Middle incomeMoldovaMonacoMongoliaMontenegroMoroccoMozambiqueMyanmarNamibiaNepalNetherlandsNew CaledoniaNew ZealandNicaraguaNigerNigeriaNorth AmericaNorwayOECD membersOmanOther small statesPacific island small statesPakistanPalauPanamaPapua New GuineaParaguayPeruPhilippinesPolandPortugalPost-demographic dividendPre-demographic dividendPuerto RicoQatarRomaniaRussian FederationRwandaSamoaSan MarinoSao Tome and PrincipeSaudi ArabiaSenegalSerbiaSeychellesSierra LeoneSingaporeSint Maarten (Dutch part)Slovak RepublicSloveniaSmall statesSolomon IslandsSomaliaSouth AfricaSouth AsiaSouth Asia (IDA & IBRD)South SudanSpainSri LankaSt. Kitts and NevisSt. LuciaSt. Martin (French part)St. Vincent and the GrenadinesSub-Saharan Africa Sub-Saharan Africa (excluding high income)Sub-Saharan Africa (IDA & IBRD countries)SudanSurinameSwazilandSwedenSwitzerlandSyrian Arab RepublicTajikistanTanzaniaThailandTimor-LesteTogoTongaTrinidad and TobagoTunisiaTurkeyTurkmenistanUgandaUkraineUnited Arab EmiratesUnited KingdomUnited StatesUpper middle incomeUruguayUzbekistanVanuatuVenezuela, RBVietnamVirgin Islands (U.S.)West Bank and GazaWorldYemen, Rep.ZambiaZimbabwe Timeline:
This timeline shows a graph from 1961 to 2015 of Oman. No data until 1960. Number of actual observations by date: 55.
Source name:
World Development Indicators
Source organization:
(1) United Nations Population Division. World Population Prospects, (2) Census reports and other statistical publications from national statistical offices, (3) Eurostat: Demographic Statistics, (4) United Nations Statistical Division. Population and Vital Statistics Reprot (various years), (5) U.S. Census Bureau: International Database, and (6) Secretariat of the Pacific Community: Statistics and Demography Programme.
Categories, topics:
Health
Last updated:
apr 23, 2017
Indicators value changes by year
Minimum:
19.918
jan 1, 2015
Maximum:
50.003
jan 1, 1979
At the date of observation
Value
Absolute change
Change from previous value
jan 1, 1961
49.347
+49.347
0.0%
jan 1, 1962
49.272
-0.075
-0.15%
jan 1, 1963
49.183
-0.089
-0.18%
jan 1, 1964
49.082
-0.101
-0.21%
jan 1, 1965
48.975
-0.107
-0.22%
jan 1, 1966
48.855
-0.12
-0.25%
jan 1, 1967
48.713
-0.142
-0.29%
jan 1, 1968
48.55
-0.163
-0.33%
jan 1, 1969
48.376
-0.174
-0.36%
jan 1, 1970
48.209
-0.167
-0.35%
jan 1, 1971
48.094
-0.115
-0.24%
jan 1, 1972
48.085
-0.009
-0.02%
jan 1, 1973
48.202
+0.117
0.24%
jan 1, 1974
48.443
+0.241
0.5%
jan 1, 1975
48.782
+0.339
0.7%
jan 1, 1976
49.173
+0.391
0.8%
jan 1, 1977
49.553
+0.38
0.77%
jan 1, 1978
49.85
+0.297
0.6%
jan 1, 1979
50.003
+0.153
0.31%
jan 1, 1980
49.973
-0.03
-0.06%
jan 1, 1981
49.744
-0.229
-0.46%
jan 1, 1982
49.323
-0.421
-0.85%
jan 1, 1983
48.744
-0.579
-1.17%
jan 1, 1984
48.03
-0.714
-1.46%
jan 1, 1985
47.181
-0.849
-1.77%
jan 1, 1986
46.167
-1.014
-2.15%
jan 1, 1987
44.949
-1.218
-2.64%
jan 1, 1988
43.519
-1.43
-3.18%
jan 1, 1989
41.895
-1.624
-3.73%
jan 1, 1990
40.117
-1.778
-4.24%
jan 1, 1991
38.247
-1.87
-4.66%
jan 1, 1992
36.355
-1.892
-4.95%
jan 1, 1993
34.512
-1.843
-5.07%
jan 1, 1994
32.775
-1.737
-5.03%
jan 1, 1995
31.185
-1.59
-4.85%
jan 1, 1996
29.755
-1.43
-4.59%
jan 1, 1997
28.47
-1.285
-4.32%
jan 1, 1998
27.29
-1.18
-4.14%
jan 1, 1999
26.187
-1.103
-4.04%
jan 1, 2000
25.164
-1.023
-3.91%
jan 1, 2001
24.238
-0.926
-3.68%
jan 1, 2002
23.435
-0.803
-3.31%
jan 1, 2003
22.773
-0.662
-2.82%
jan 1, 2004
22.256
-0.517
-2.27%
jan 1, 2005
21.874
-0.382
-1.72%
jan 1, 2006
21.618
-0.256
-1.17%
jan 1, 2007
21.475
-0.143
-0.66%
jan 1, 2008
21.409
-0.066
-0.31%
jan 1, 2009
21.379
-0.03
-0.14%
jan 1, 2010
21.347
-0.032
-0.15%
jan 1, 2011
21.265
-0.082
-0.38%
jan 1, 2012
21.091
-0.174
-0.82%
jan 1, 2013
20.81
-0.281
-1.33%
jan 1, 2014
20.419
-0.391
-1.88%
jan 1, 2015
19.918
-0.501
-2.45%
Ranking of countries by current statistics by years


Comments: