29
/
en
AIzaSyAYiBZKx7MnpbEhh9jyipgxe19OcubqV5w
April 1, 2024
230721
Rwanda
RWA
true
2
1
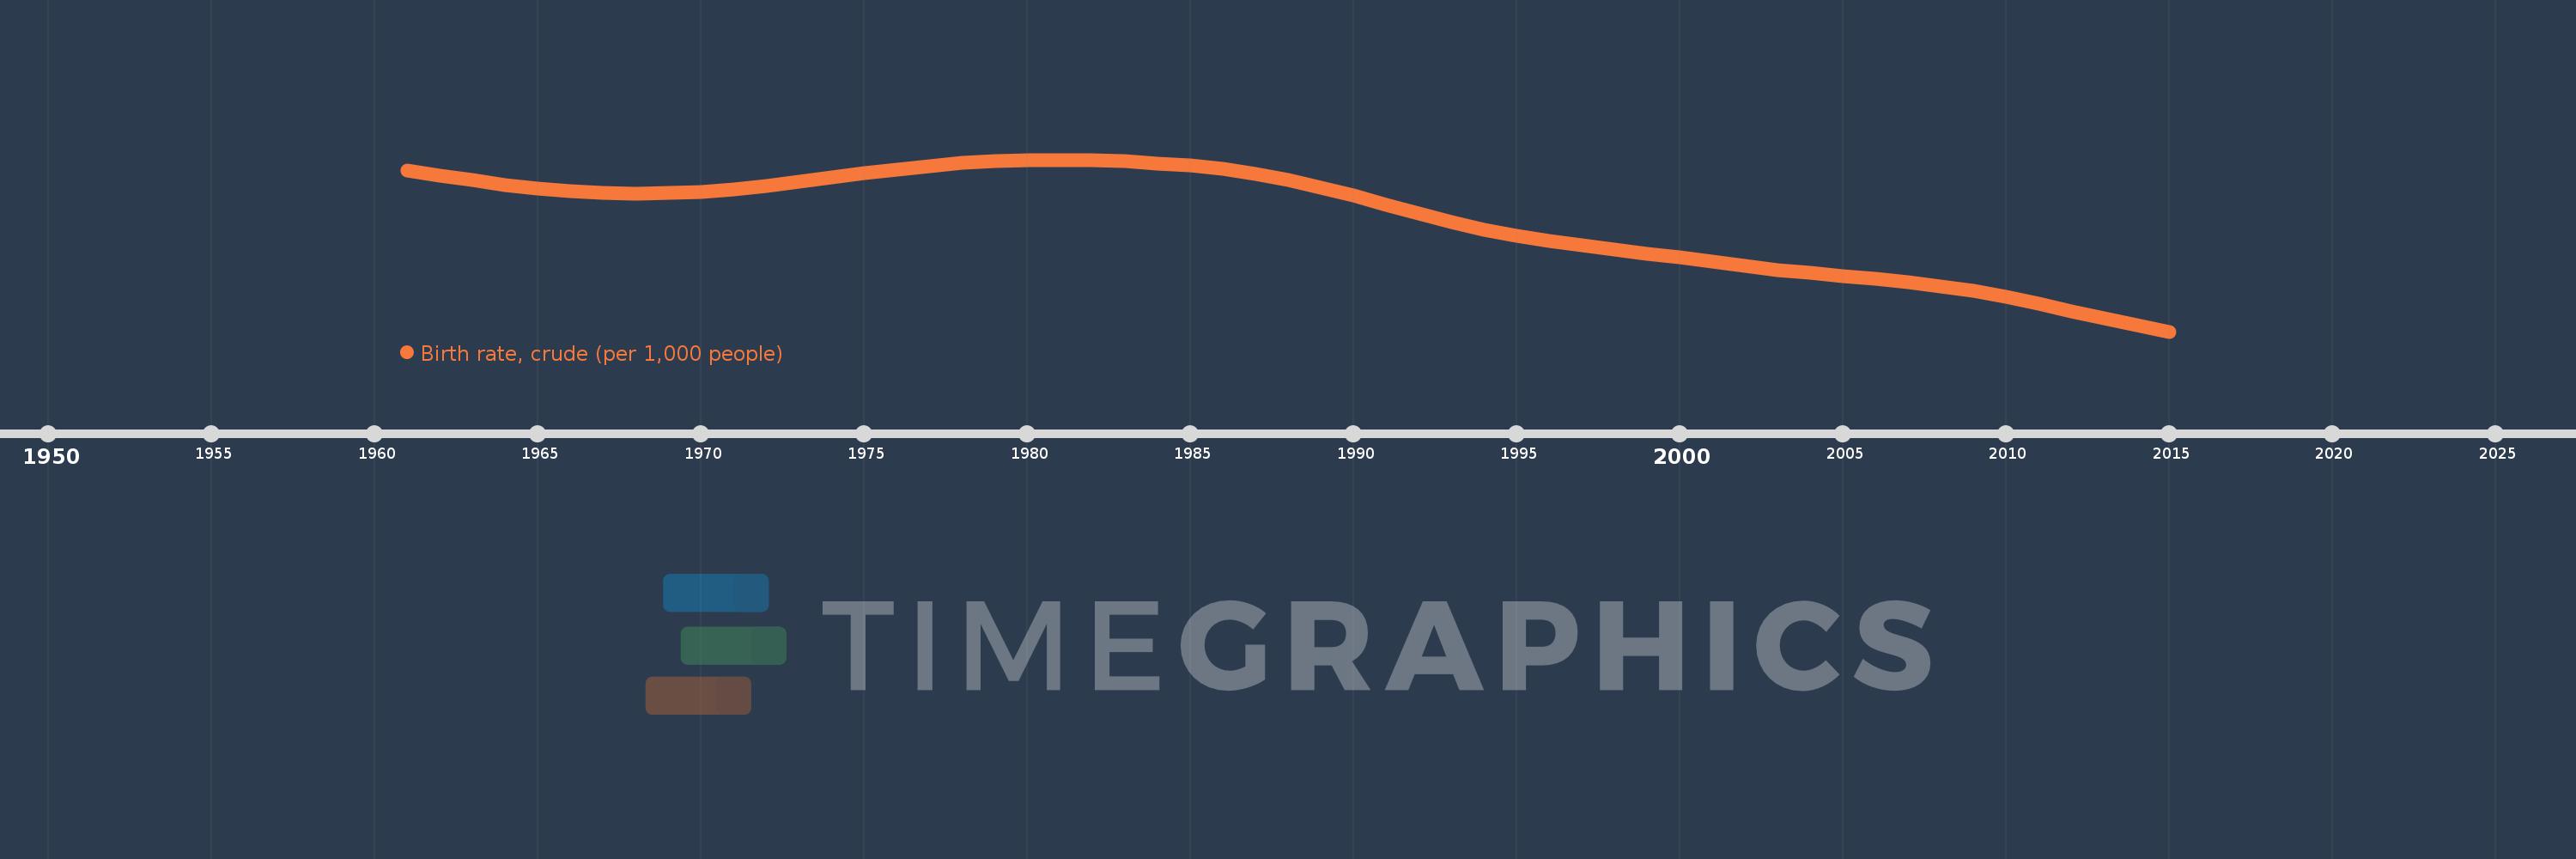
Birth rate, crude (per 1,000 people)
2015,2014,2013,2012,2011,2010,2009,2008,2007,2006,2005,2004,2003,2002,2001,2000,1999,1998,1997,1996,1995,1994,1993,1992,1991,1990,1989,1988,1987,1986,1985,1984,1983,1982,1981,1980,1979,1978,1977,1976,1975,1974,1973,1972,1971,1970,1969,1968,1967,1966,1965,1964,1963,1962,1961
This statistics in other country:
AfghanistanAlbaniaAlgeriaAmerican SamoaAndorraAngolaAntigua and BarbudaArab WorldArgentinaArmeniaArubaAustraliaAustriaAzerbaijanBahamas, TheBahrainBangladeshBarbadosBelarusBelgiumBelizeBeninBermudaBhutanBoliviaBosnia and HerzegovinaBotswanaBrazilBrunei DarussalamBulgariaBurkina FasoBurundiCabo VerdeCambodiaCameroonCanadaCaribbean small statesCayman IslandsCentral African RepublicCentral Europe and the BalticsChadChannel IslandsChileChinaColombiaComorosCongo, Dem. Rep.Congo, Rep.Costa RicaCote d'IvoireCroatiaCubaCuracaoCyprusCzech RepublicDenmarkDjiboutiDominicaDominican RepublicEarly-demographic dividendEast Asia & PacificEast Asia & Pacific (excluding high income)East Asia & Pacific (IDA & IBRD countries)EcuadorEgypt, Arab Rep.El SalvadorEquatorial GuineaEritreaEstoniaEthiopiaEuro areaEurope & Central AsiaEurope & Central Asia (excluding high income)Europe & Central Asia (IDA & IBRD countries)European UnionFaroe IslandsFijiFinlandFragile and conflict affected situationsFranceFrench PolynesiaGabonGambia, TheGeorgiaGermanyGhanaGreeceGreenlandGrenadaGuamGuatemalaGuineaGuinea-BissauGuyanaHaitiHeavily indebted poor countries (HIPC)High incomeHondurasHong Kong SAR, ChinaHungaryIBRD onlyIcelandIDA & IBRD totalIDA blendIDA onlyIDA totalIndiaIndonesiaIran, Islamic Rep.IraqIrelandIsle of ManIsraelItalyJamaicaJapanJordanKazakhstanKenyaKiribatiKorea, Dem. People’s Rep.Korea, Rep.KosovoKuwaitKyrgyz RepublicLao PDRLate-demographic dividendLatin America & Caribbean Latin America & Caribbean (excluding high income)Latin America & the Caribbean (IDA & IBRD countries)LatviaLeast developed countries: UN classificationLebanonLesothoLiberiaLibyaLiechtensteinLithuaniaLow & middle incomeLow incomeLower middle incomeLuxembourgMacao SAR, ChinaMacedonia, FYRMadagascarMalawiMalaysiaMaldivesMaliMaltaMarshall IslandsMauritaniaMauritiusMexicoMicronesia, Fed. Sts.Middle East & North AfricaMiddle East & North Africa (excluding high income)Middle East & North Africa (IDA & IBRD countries)Middle incomeMoldovaMonacoMongoliaMontenegroMoroccoMozambiqueMyanmarNamibiaNepalNetherlandsNew CaledoniaNew ZealandNicaraguaNigerNigeriaNorth AmericaNorwayOECD membersOmanOther small statesPacific island small statesPakistanPalauPanamaPapua New GuineaParaguayPeruPhilippinesPolandPortugalPost-demographic dividendPre-demographic dividendPuerto RicoQatarRomaniaRussian FederationRwandaSamoaSan MarinoSao Tome and PrincipeSaudi ArabiaSenegalSerbiaSeychellesSierra LeoneSingaporeSint Maarten (Dutch part)Slovak RepublicSloveniaSmall statesSolomon IslandsSomaliaSouth AfricaSouth AsiaSouth Asia (IDA & IBRD)South SudanSpainSri LankaSt. Kitts and NevisSt. LuciaSt. Martin (French part)St. Vincent and the GrenadinesSub-Saharan Africa Sub-Saharan Africa (excluding high income)Sub-Saharan Africa (IDA & IBRD countries)SudanSurinameSwazilandSwedenSwitzerlandSyrian Arab RepublicTajikistanTanzaniaThailandTimor-LesteTogoTongaTrinidad and TobagoTunisiaTurkeyTurkmenistanUgandaUkraineUnited Arab EmiratesUnited KingdomUnited StatesUpper middle incomeUruguayUzbekistanVanuatuVenezuela, RBVietnamVirgin Islands (U.S.)West Bank and GazaWorldYemen, Rep.ZambiaZimbabwe Timeline:
This timeline shows a graph from 1961 to 2015 of Rwanda. No data until 1960. Number of actual observations by date: 55.
Source name:
World Development Indicators
Source organization:
(1) United Nations Population Division. World Population Prospects, (2) Census reports and other statistical publications from national statistical offices, (3) Eurostat: Demographic Statistics, (4) United Nations Statistical Division. Population and Vital Statistics Reprot (various years), (5) U.S. Census Bureau: International Database, and (6) Secretariat of the Pacific Community: Statistics and Demography Programme.
Categories, topics:
Health
Last updated:
apr 23, 2017
Indicators value changes by year
Maximum:
53.623
jan 1, 1981
At the date of observation
Value
Absolute change
Change from previous value
jan 1, 1961
52.248
+52.248
0.0%
jan 1, 1962
51.642
-0.606
-1.16%
jan 1, 1963
51.036
-0.606
-1.17%
jan 1, 1964
50.471
-0.565
-1.11%
jan 1, 1965
49.985
-0.486
-0.96%
jan 1, 1966
49.617
-0.368
-0.74%
jan 1, 1967
49.398
-0.219
-0.44%
jan 1, 1968
49.327
-0.071
-0.14%
jan 1, 1969
49.393
+0.066
0.13%
jan 1, 1970
49.59
+0.197
0.4%
jan 1, 1971
49.911
+0.321
0.65%
jan 1, 1972
50.341
+0.43
0.86%
jan 1, 1973
50.845
+0.504
1.0%
jan 1, 1974
51.383
+0.538
1.06%
jan 1, 1975
51.919
+0.536
1.04%
jan 1, 1976
52.415
+0.496
0.96%
jan 1, 1977
52.843
+0.428
0.82%
jan 1, 1978
53.19
+0.347
0.66%
jan 1, 1979
53.444
+0.254
0.48%
jan 1, 1980
53.588
+0.144
0.27%
jan 1, 1981
53.623
+0.035
0.07%
jan 1, 1982
53.556
-0.067
-0.12%
jan 1, 1983
53.406
-0.15
-0.28%
jan 1, 1984
53.179
-0.227
-0.43%
jan 1, 1985
52.867
-0.312
-0.59%
jan 1, 1986
52.437
-0.43
-0.81%
jan 1, 1987
51.843
-0.594
-1.13%
jan 1, 1988
51.072
-0.771
-1.49%
jan 1, 1989
50.134
-0.938
-1.84%
jan 1, 1990
49.063
-1.071
-2.14%
jan 1, 1991
47.922
-1.141
-2.33%
jan 1, 1992
46.787
-1.135
-2.37%
jan 1, 1993
45.727
-1.06
-2.27%
jan 1, 1994
44.792
-0.935
-2.04%
jan 1, 1995
44.003
-0.789
-1.76%
jan 1, 1996
43.352
-0.651
-1.48%
jan 1, 1997
42.802
-0.55
-1.27%
jan 1, 1998
42.292
-0.51
-1.19%
jan 1, 1999
41.775
-0.517
-1.22%
jan 1, 2000
41.239
-0.536
-1.28%
jan 1, 2001
40.697
-0.542
-1.31%
jan 1, 2002
40.179
-0.518
-1.27%
jan 1, 2003
39.712
-0.467
-1.16%
jan 1, 2004
39.306
-0.406
-1.02%
jan 1, 2005
38.943
-0.363
-0.92%
jan 1, 2006
38.58
-0.363
-0.93%
jan 1, 2007
38.161
-0.419
-1.09%
jan 1, 2008
37.643
-0.518
-1.36%
jan 1, 2009
37.003
-0.64
-1.7%
jan 1, 2010
36.241
-0.762
-2.06%
jan 1, 2011
35.381
-0.86
-2.37%
jan 1, 2012
34.467
-0.914
-2.58%
jan 1, 2013
33.554
-0.913
-2.65%
jan 1, 2014
32.689
-0.865
-2.58%
jan 1, 2015
31.89
-0.799
-2.44%
Ranking of countries by current statistics by years


Comments: