29
/
en
AIzaSyAYiBZKx7MnpbEhh9jyipgxe19OcubqV5w
April 1, 2024
125846
El Salvador
SLV
true
2
1
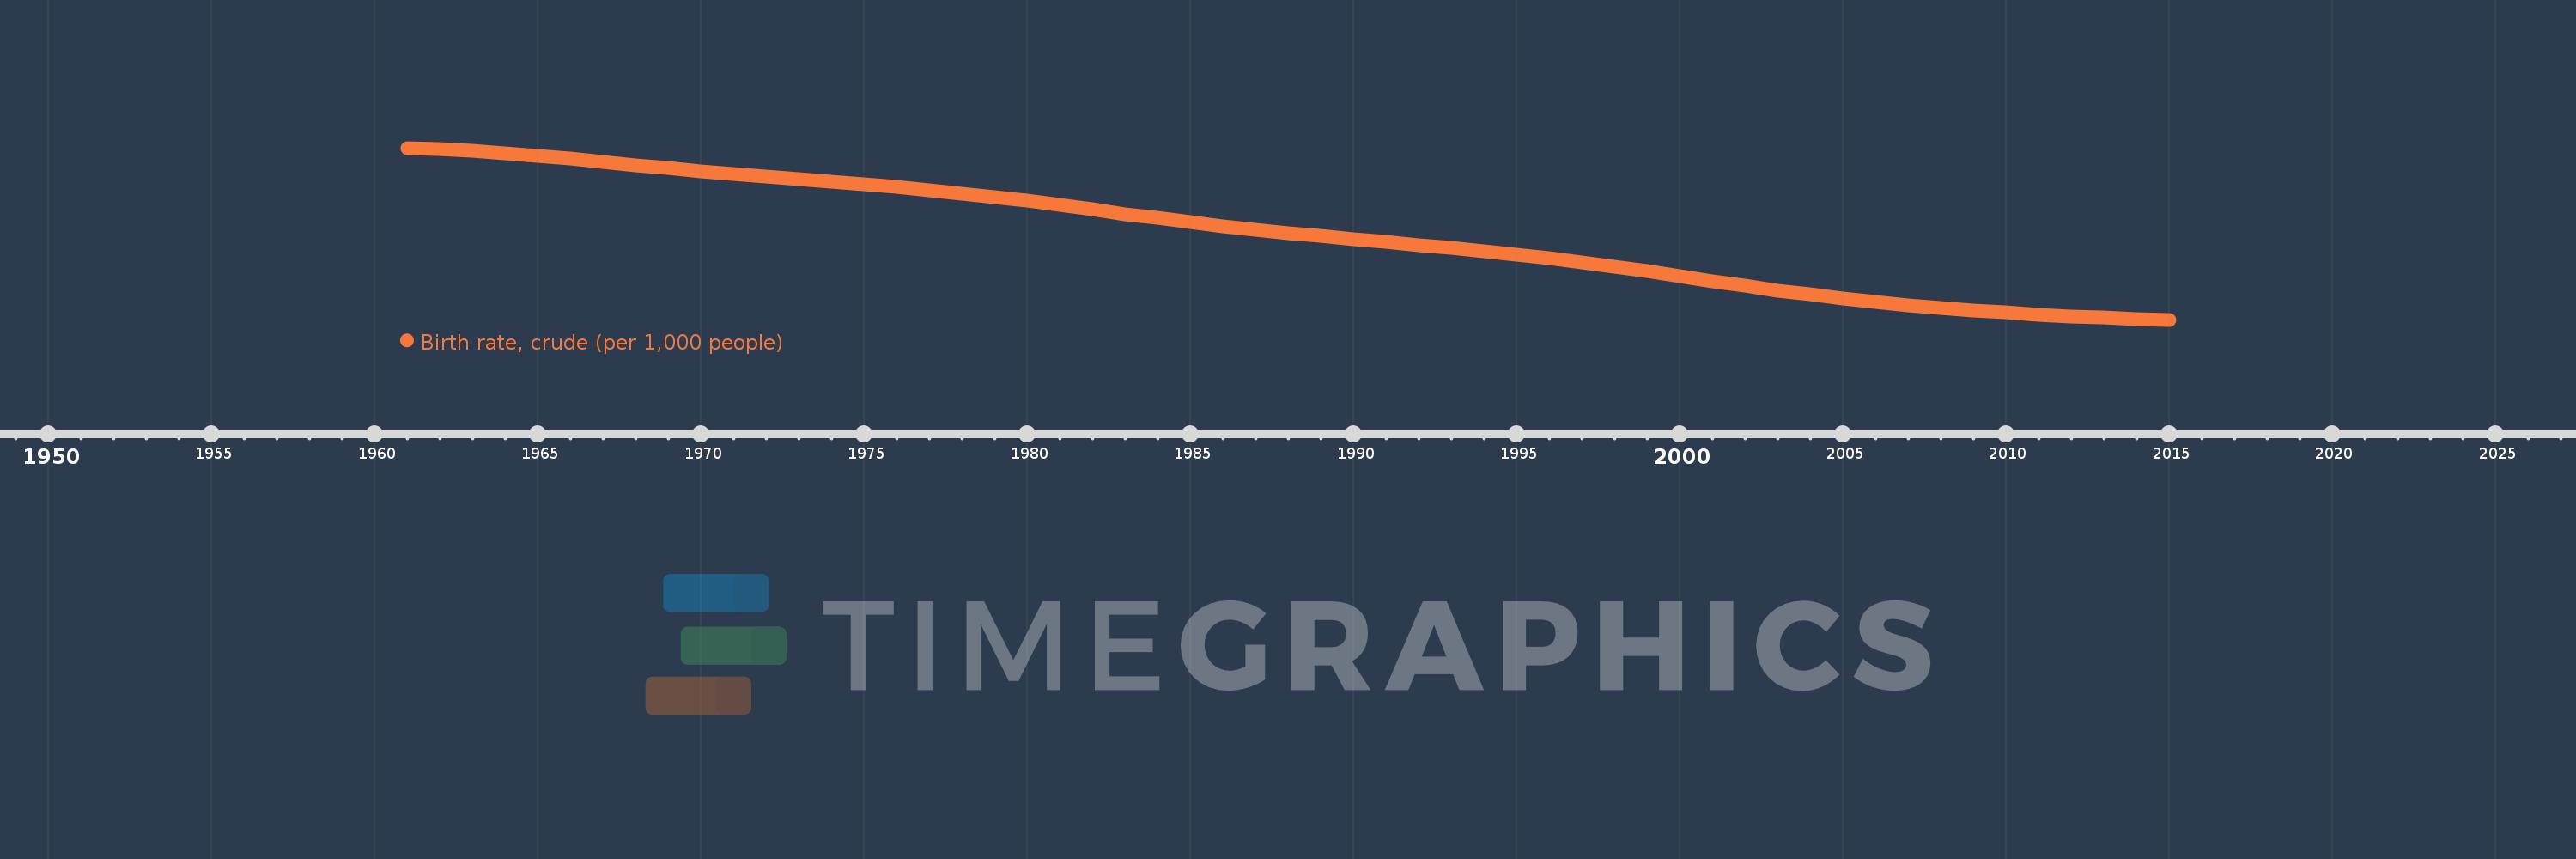
Birth rate, crude (per 1,000 people)
2015,2014,2013,2012,2011,2010,2009,2008,2007,2006,2005,2004,2003,2002,2001,2000,1999,1998,1997,1996,1995,1994,1993,1992,1991,1990,1989,1988,1987,1986,1985,1984,1983,1982,1981,1980,1979,1978,1977,1976,1975,1974,1973,1972,1971,1970,1969,1968,1967,1966,1965,1964,1963,1962,1961
This statistics in other country:
AfghanistanAlbaniaAlgeriaAmerican SamoaAndorraAngolaAntigua and BarbudaArab WorldArgentinaArmeniaArubaAustraliaAustriaAzerbaijanBahamas, TheBahrainBangladeshBarbadosBelarusBelgiumBelizeBeninBermudaBhutanBoliviaBosnia and HerzegovinaBotswanaBrazilBrunei DarussalamBulgariaBurkina FasoBurundiCabo VerdeCambodiaCameroonCanadaCaribbean small statesCayman IslandsCentral African RepublicCentral Europe and the BalticsChadChannel IslandsChileChinaColombiaComorosCongo, Dem. Rep.Congo, Rep.Costa RicaCote d'IvoireCroatiaCubaCuracaoCyprusCzech RepublicDenmarkDjiboutiDominicaDominican RepublicEarly-demographic dividendEast Asia & PacificEast Asia & Pacific (excluding high income)East Asia & Pacific (IDA & IBRD countries)EcuadorEgypt, Arab Rep.El SalvadorEquatorial GuineaEritreaEstoniaEthiopiaEuro areaEurope & Central AsiaEurope & Central Asia (excluding high income)Europe & Central Asia (IDA & IBRD countries)European UnionFaroe IslandsFijiFinlandFragile and conflict affected situationsFranceFrench PolynesiaGabonGambia, TheGeorgiaGermanyGhanaGreeceGreenlandGrenadaGuamGuatemalaGuineaGuinea-BissauGuyanaHaitiHeavily indebted poor countries (HIPC)High incomeHondurasHong Kong SAR, ChinaHungaryIBRD onlyIcelandIDA & IBRD totalIDA blendIDA onlyIDA totalIndiaIndonesiaIran, Islamic Rep.IraqIrelandIsle of ManIsraelItalyJamaicaJapanJordanKazakhstanKenyaKiribatiKorea, Dem. People’s Rep.Korea, Rep.KosovoKuwaitKyrgyz RepublicLao PDRLate-demographic dividendLatin America & Caribbean Latin America & Caribbean (excluding high income)Latin America & the Caribbean (IDA & IBRD countries)LatviaLeast developed countries: UN classificationLebanonLesothoLiberiaLibyaLiechtensteinLithuaniaLow & middle incomeLow incomeLower middle incomeLuxembourgMacao SAR, ChinaMacedonia, FYRMadagascarMalawiMalaysiaMaldivesMaliMaltaMarshall IslandsMauritaniaMauritiusMexicoMicronesia, Fed. Sts.Middle East & North AfricaMiddle East & North Africa (excluding high income)Middle East & North Africa (IDA & IBRD countries)Middle incomeMoldovaMonacoMongoliaMontenegroMoroccoMozambiqueMyanmarNamibiaNepalNetherlandsNew CaledoniaNew ZealandNicaraguaNigerNigeriaNorth AmericaNorwayOECD membersOmanOther small statesPacific island small statesPakistanPalauPanamaPapua New GuineaParaguayPeruPhilippinesPolandPortugalPost-demographic dividendPre-demographic dividendPuerto RicoQatarRomaniaRussian FederationRwandaSamoaSan MarinoSao Tome and PrincipeSaudi ArabiaSenegalSerbiaSeychellesSierra LeoneSingaporeSint Maarten (Dutch part)Slovak RepublicSloveniaSmall statesSolomon IslandsSomaliaSouth AfricaSouth AsiaSouth Asia (IDA & IBRD)South SudanSpainSri LankaSt. Kitts and NevisSt. LuciaSt. Martin (French part)St. Vincent and the GrenadinesSub-Saharan Africa Sub-Saharan Africa (excluding high income)Sub-Saharan Africa (IDA & IBRD countries)SudanSurinameSwazilandSwedenSwitzerlandSyrian Arab RepublicTajikistanTanzaniaThailandTimor-LesteTogoTongaTrinidad and TobagoTunisiaTurkeyTurkmenistanUgandaUkraineUnited Arab EmiratesUnited KingdomUnited StatesUpper middle incomeUruguayUzbekistanVanuatuVenezuela, RBVietnamVirgin Islands (U.S.)West Bank and GazaWorldYemen, Rep.ZambiaZimbabwe Timeline:
This timeline shows a graph from 1961 to 2015 of El Salvador. No data until 1960. Number of actual observations by date: 55.
Source name:
World Development Indicators
Source organization:
(1) United Nations Population Division. World Population Prospects, (2) Census reports and other statistical publications from national statistical offices, (3) Eurostat: Demographic Statistics, (4) United Nations Statistical Division. Population and Vital Statistics Reprot (various years), (5) U.S. Census Bureau: International Database, and (6) Secretariat of the Pacific Community: Statistics and Demography Programme.
Categories, topics:
Health
Last updated:
apr 23, 2017
Indicators value changes by year
Minimum:
17.314
jan 1, 2015
Maximum:
47.381
jan 1, 1961
At the date of observation
Value
Absolute change
Change from previous value
jan 1, 1961
47.381
+47.381
0.0%
jan 1, 1962
47.17
-0.211
-0.45%
jan 1, 1963
46.866
-0.304
-0.64%
jan 1, 1964
46.472
-0.394
-0.84%
jan 1, 1965
46.003
-0.469
-1.01%
jan 1, 1966
45.481
-0.522
-1.13%
jan 1, 1967
44.93
-0.551
-1.21%
jan 1, 1968
44.375
-0.555
-1.24%
jan 1, 1969
43.833
-0.542
-1.22%
jan 1, 1970
43.317
-0.516
-1.18%
jan 1, 1971
42.834
-0.483
-1.12%
jan 1, 1972
42.382
-0.452
-1.06%
jan 1, 1973
41.946
-0.436
-1.03%
jan 1, 1974
41.506
-0.44
-1.05%
jan 1, 1975
41.052
-0.454
-1.09%
jan 1, 1976
40.566
-0.486
-1.18%
jan 1, 1977
40.03
-0.536
-1.32%
jan 1, 1978
39.438
-0.592
-1.48%
jan 1, 1979
38.79
-0.648
-1.64%
jan 1, 1980
38.091
-0.699
-1.8%
jan 1, 1981
37.353
-0.738
-1.94%
jan 1, 1982
36.593
-0.76
-2.03%
jan 1, 1983
35.833
-0.76
-2.08%
jan 1, 1984
35.093
-0.74
-2.07%
jan 1, 1985
34.383
-0.71
-2.02%
jan 1, 1986
33.716
-0.667
-1.94%
jan 1, 1987
33.096
-0.62
-1.84%
jan 1, 1988
32.516
-0.58
-1.75%
jan 1, 1989
31.963
-0.553
-1.7%
jan 1, 1990
31.429
-0.534
-1.67%
jan 1, 1991
30.904
-0.525
-1.67%
jan 1, 1992
30.379
-0.525
-1.7%
jan 1, 1993
29.84
-0.539
-1.77%
jan 1, 1994
29.277
-0.563
-1.89%
jan 1, 1995
28.681
-0.596
-2.04%
jan 1, 1996
28.037
-0.644
-2.25%
jan 1, 1997
27.333
-0.704
-2.51%
jan 1, 1998
26.572
-0.761
-2.78%
jan 1, 1999
25.767
-0.805
-3.03%
jan 1, 2000
24.93
-0.837
-3.25%
jan 1, 2001
24.083
-0.847
-3.4%
jan 1, 2002
23.249
-0.834
-3.46%
jan 1, 2003
22.45
-0.799
-3.44%
jan 1, 2004
21.705
-0.745
-3.32%
jan 1, 2005
21.028
-0.677
-3.12%
jan 1, 2006
20.422
-0.606
-2.88%
jan 1, 2007
19.887
-0.535
-2.62%
jan 1, 2008
19.406
-0.481
-2.42%
jan 1, 2009
18.969
-0.437
-2.25%
jan 1, 2010
18.574
-0.395
-2.08%
jan 1, 2011
18.223
-0.351
-1.89%
jan 1, 2012
17.924
-0.299
-1.64%
jan 1, 2013
17.676
-0.248
-1.38%
jan 1, 2014
17.476
-0.2
-1.13%
jan 1, 2015
17.314
-0.162
-0.93%
Ranking of countries by current statistics by years


Comments: