29
/
en
AIzaSyAYiBZKx7MnpbEhh9jyipgxe19OcubqV5w
April 1, 2024
179773
Libya
LBY
true
2
1
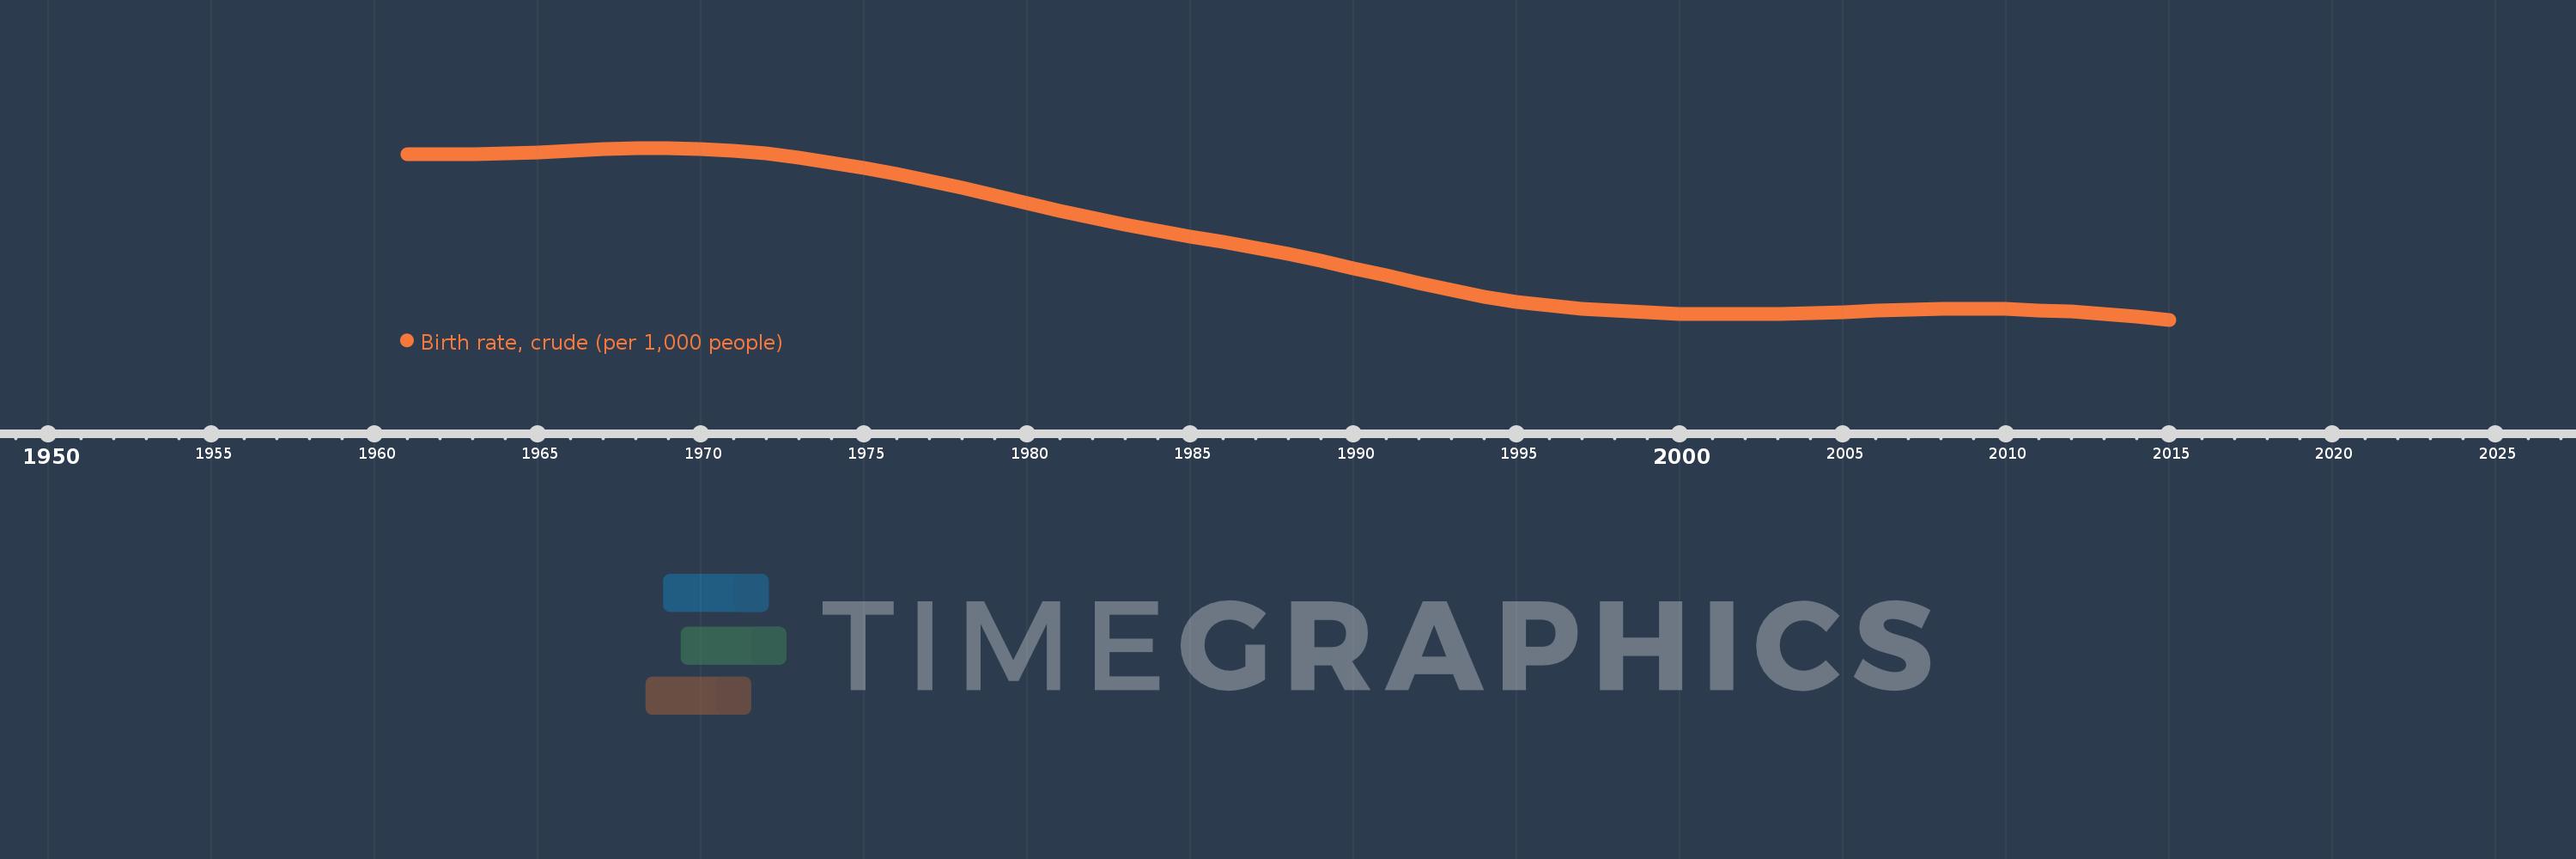
Birth rate, crude (per 1,000 people)
2015,2014,2013,2012,2011,2010,2009,2008,2007,2006,2005,2004,2003,2002,2001,2000,1999,1998,1997,1996,1995,1994,1993,1992,1991,1990,1989,1988,1987,1986,1985,1984,1983,1982,1981,1980,1979,1978,1977,1976,1975,1974,1973,1972,1971,1970,1969,1968,1967,1966,1965,1964,1963,1962,1961
This statistics in other country:
AfghanistanAlbaniaAlgeriaAmerican SamoaAndorraAngolaAntigua and BarbudaArab WorldArgentinaArmeniaArubaAustraliaAustriaAzerbaijanBahamas, TheBahrainBangladeshBarbadosBelarusBelgiumBelizeBeninBermudaBhutanBoliviaBosnia and HerzegovinaBotswanaBrazilBrunei DarussalamBulgariaBurkina FasoBurundiCabo VerdeCambodiaCameroonCanadaCaribbean small statesCayman IslandsCentral African RepublicCentral Europe and the BalticsChadChannel IslandsChileChinaColombiaComorosCongo, Dem. Rep.Congo, Rep.Costa RicaCote d'IvoireCroatiaCubaCuracaoCyprusCzech RepublicDenmarkDjiboutiDominicaDominican RepublicEarly-demographic dividendEast Asia & PacificEast Asia & Pacific (excluding high income)East Asia & Pacific (IDA & IBRD countries)EcuadorEgypt, Arab Rep.El SalvadorEquatorial GuineaEritreaEstoniaEthiopiaEuro areaEurope & Central AsiaEurope & Central Asia (excluding high income)Europe & Central Asia (IDA & IBRD countries)European UnionFaroe IslandsFijiFinlandFragile and conflict affected situationsFranceFrench PolynesiaGabonGambia, TheGeorgiaGermanyGhanaGreeceGreenlandGrenadaGuamGuatemalaGuineaGuinea-BissauGuyanaHaitiHeavily indebted poor countries (HIPC)High incomeHondurasHong Kong SAR, ChinaHungaryIBRD onlyIcelandIDA & IBRD totalIDA blendIDA onlyIDA totalIndiaIndonesiaIran, Islamic Rep.IraqIrelandIsle of ManIsraelItalyJamaicaJapanJordanKazakhstanKenyaKiribatiKorea, Dem. People’s Rep.Korea, Rep.KosovoKuwaitKyrgyz RepublicLao PDRLate-demographic dividendLatin America & Caribbean Latin America & Caribbean (excluding high income)Latin America & the Caribbean (IDA & IBRD countries)LatviaLeast developed countries: UN classificationLebanonLesothoLiberiaLibyaLiechtensteinLithuaniaLow & middle incomeLow incomeLower middle incomeLuxembourgMacao SAR, ChinaMacedonia, FYRMadagascarMalawiMalaysiaMaldivesMaliMaltaMarshall IslandsMauritaniaMauritiusMexicoMicronesia, Fed. Sts.Middle East & North AfricaMiddle East & North Africa (excluding high income)Middle East & North Africa (IDA & IBRD countries)Middle incomeMoldovaMonacoMongoliaMontenegroMoroccoMozambiqueMyanmarNamibiaNepalNetherlandsNew CaledoniaNew ZealandNicaraguaNigerNigeriaNorth AmericaNorwayOECD membersOmanOther small statesPacific island small statesPakistanPalauPanamaPapua New GuineaParaguayPeruPhilippinesPolandPortugalPost-demographic dividendPre-demographic dividendPuerto RicoQatarRomaniaRussian FederationRwandaSamoaSan MarinoSao Tome and PrincipeSaudi ArabiaSenegalSerbiaSeychellesSierra LeoneSingaporeSint Maarten (Dutch part)Slovak RepublicSloveniaSmall statesSolomon IslandsSomaliaSouth AfricaSouth AsiaSouth Asia (IDA & IBRD)South SudanSpainSri LankaSt. Kitts and NevisSt. LuciaSt. Martin (French part)St. Vincent and the GrenadinesSub-Saharan Africa Sub-Saharan Africa (excluding high income)Sub-Saharan Africa (IDA & IBRD countries)SudanSurinameSwazilandSwedenSwitzerlandSyrian Arab RepublicTajikistanTanzaniaThailandTimor-LesteTogoTongaTrinidad and TobagoTunisiaTurkeyTurkmenistanUgandaUkraineUnited Arab EmiratesUnited KingdomUnited StatesUpper middle incomeUruguayUzbekistanVanuatuVenezuela, RBVietnamVirgin Islands (U.S.)West Bank and GazaWorldYemen, Rep.ZambiaZimbabwe Timeline:
This timeline shows a graph from 1961 to 2015 of Libya. No data until 1960. Number of actual observations by date: 55.
Source name:
World Development Indicators
Source organization:
(1) United Nations Population Division. World Population Prospects, (2) Census reports and other statistical publications from national statistical offices, (3) Eurostat: Demographic Statistics, (4) United Nations Statistical Division. Population and Vital Statistics Reprot (various years), (5) U.S. Census Bureau: International Database, and (6) Secretariat of the Pacific Community: Statistics and Demography Programme.
Categories, topics:
Health
Last updated:
apr 23, 2017
Indicators value changes by year
Minimum:
20.887
jan 1, 2015
Maximum:
51.457
jan 1, 1969
At the date of observation
Value
Absolute change
Change from previous value
jan 1, 1961
50.397
+50.397
0.0%
jan 1, 1962
50.326
-0.071
-0.14%
jan 1, 1963
50.354
+0.028
0.06%
jan 1, 1964
50.489
+0.135
0.27%
jan 1, 1965
50.712
+0.223
0.44%
jan 1, 1966
50.982
+0.27
0.53%
jan 1, 1967
51.24
+0.258
0.51%
jan 1, 1968
51.418
+0.178
0.35%
jan 1, 1969
51.457
+0.039
0.08%
jan 1, 1970
51.322
-0.135
-0.26%
jan 1, 1971
50.988
-0.334
-0.65%
jan 1, 1972
50.449
-0.539
-1.06%
jan 1, 1973
49.737
-0.712
-1.41%
jan 1, 1974
48.887
-0.85
-1.71%
jan 1, 1975
47.915
-0.972
-1.99%
jan 1, 1976
46.83
-1.085
-2.26%
jan 1, 1977
45.638
-1.192
-2.55%
jan 1, 1978
44.356
-1.282
-2.81%
jan 1, 1979
43.013
-1.343
-3.03%
jan 1, 1980
41.642
-1.371
-3.19%
jan 1, 1981
40.291
-1.351
-3.24%
jan 1, 1982
39.008
-1.283
-3.18%
jan 1, 1983
37.813
-1.195
-3.06%
jan 1, 1984
36.708
-1.105
-2.92%
jan 1, 1985
35.684
-1.024
-2.79%
jan 1, 1986
34.697
-0.987
-2.77%
jan 1, 1987
33.68
-1.017
-2.93%
jan 1, 1988
32.58
-1.1
-3.27%
jan 1, 1989
31.375
-1.205
-3.7%
jan 1, 1990
30.076
-1.299
-4.14%
jan 1, 1991
28.726
-1.35
-4.49%
jan 1, 1992
27.386
-1.34
-4.66%
jan 1, 1993
26.135
-1.251
-4.57%
jan 1, 1994
25.033
-1.102
-4.22%
jan 1, 1995
24.112
-0.921
-3.68%
jan 1, 1996
23.385
-0.727
-3.02%
jan 1, 1997
22.845
-0.54
-2.31%
jan 1, 1998
22.45
-0.395
-1.73%
jan 1, 1999
22.163
-0.287
-1.28%
jan 1, 2000
21.967
-0.196
-0.88%
jan 1, 2001
21.859
-0.108
-0.49%
jan 1, 2002
21.845
-0.014
-0.06%
jan 1, 2003
21.92
+0.075
0.34%
jan 1, 2004
22.069
+0.149
0.68%
jan 1, 2005
22.261
+0.192
0.87%
jan 1, 2006
22.462
+0.201
0.9%
jan 1, 2007
22.638
+0.176
0.78%
jan 1, 2008
22.761
+0.123
0.54%
jan 1, 2009
22.806
+0.045
0.2%
jan 1, 2010
22.754
-0.052
-0.23%
jan 1, 2011
22.586
-0.168
-0.74%
jan 1, 2012
22.295
-0.291
-1.29%
jan 1, 2013
21.9
-0.395
-1.77%
jan 1, 2014
21.425
-0.475
-2.17%
jan 1, 2015
20.887
-0.538
-2.51%
Ranking of countries by current statistics by years


Comments: