29
/
en
AIzaSyAYiBZKx7MnpbEhh9jyipgxe19OcubqV5w
April 1, 2024
265531
Tonga
TON
true
2
1
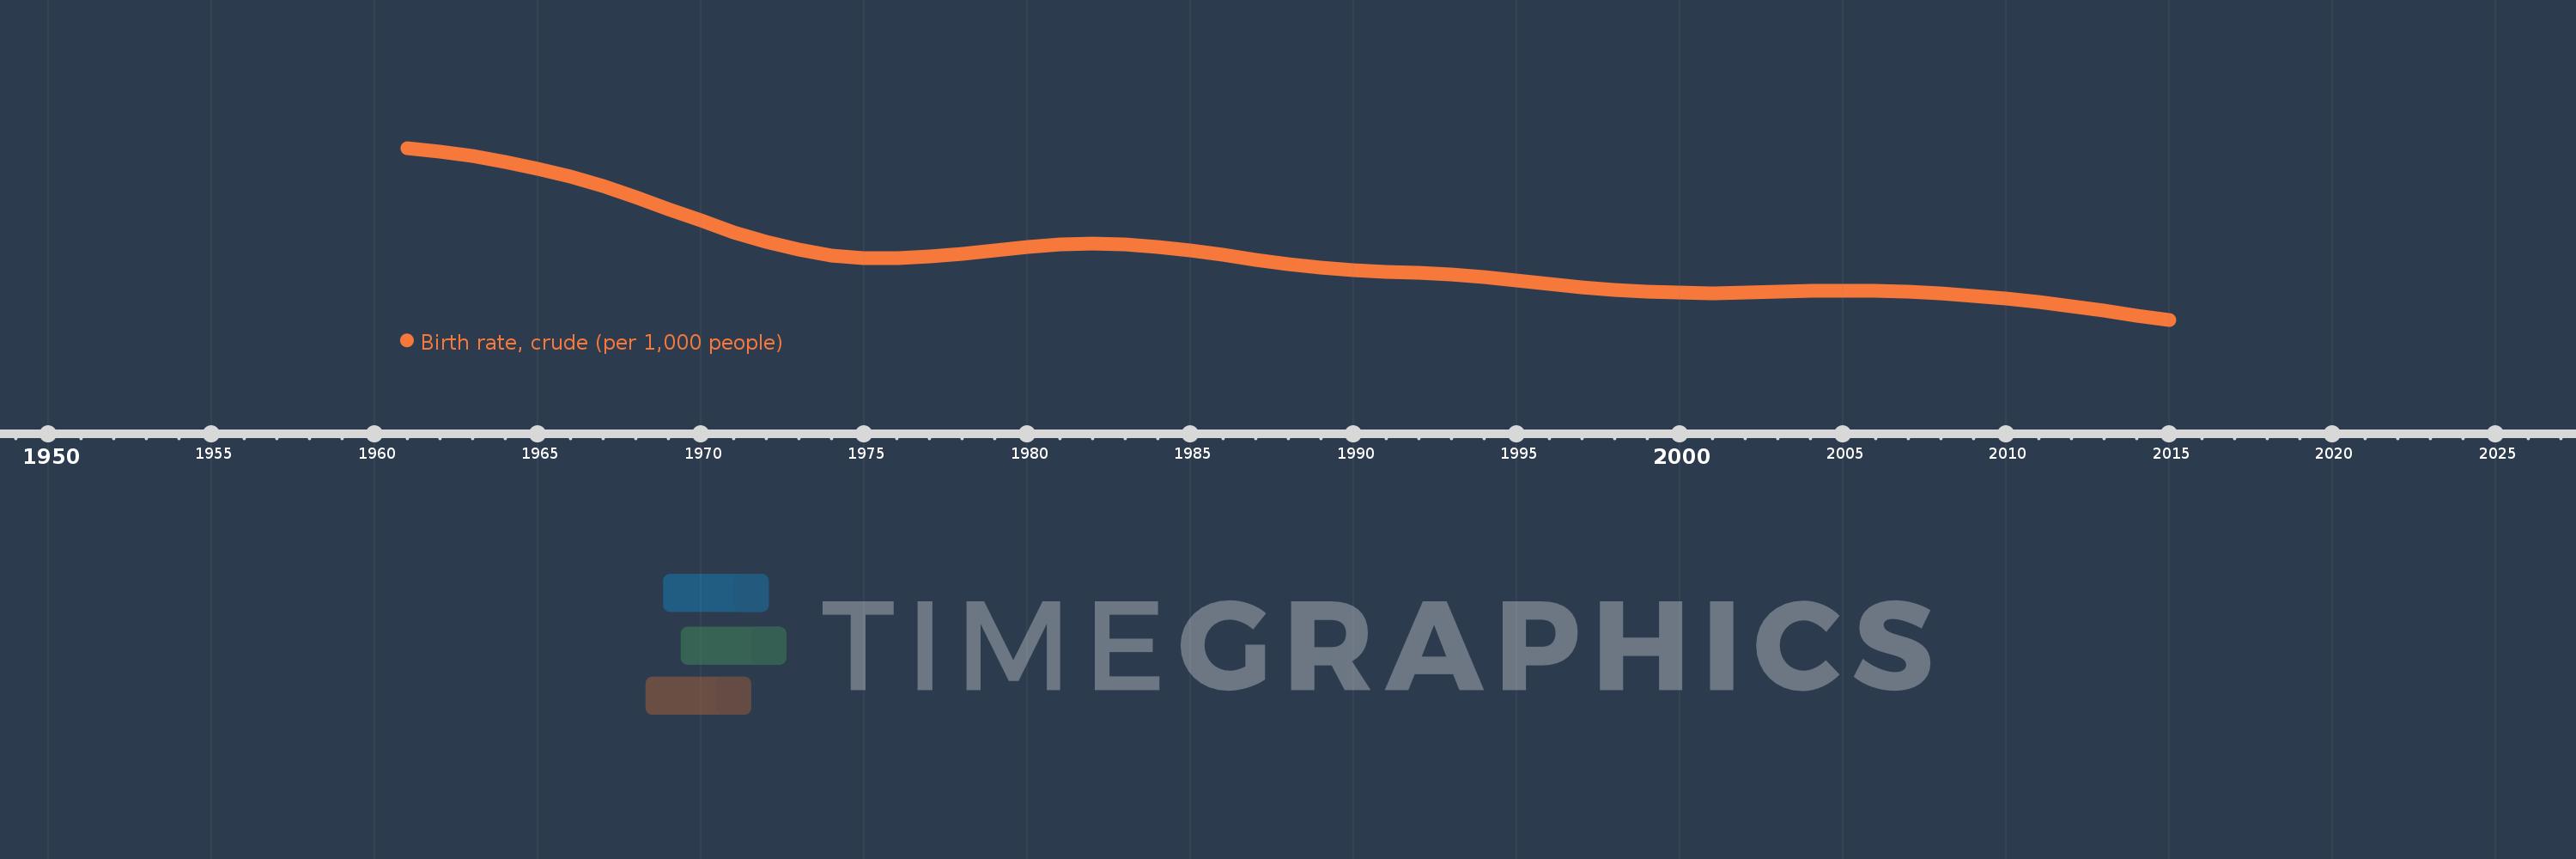
Birth rate, crude (per 1,000 people)
2015,2014,2013,2012,2011,2010,2009,2008,2007,2006,2005,2004,2003,2002,2001,2000,1999,1998,1997,1996,1995,1994,1993,1992,1991,1990,1989,1988,1987,1986,1985,1984,1983,1982,1981,1980,1979,1978,1977,1976,1975,1974,1973,1972,1971,1970,1969,1968,1967,1966,1965,1964,1963,1962,1961
This statistics in other country:
AfghanistanAlbaniaAlgeriaAmerican SamoaAndorraAngolaAntigua and BarbudaArab WorldArgentinaArmeniaArubaAustraliaAustriaAzerbaijanBahamas, TheBahrainBangladeshBarbadosBelarusBelgiumBelizeBeninBermudaBhutanBoliviaBosnia and HerzegovinaBotswanaBrazilBrunei DarussalamBulgariaBurkina FasoBurundiCabo VerdeCambodiaCameroonCanadaCaribbean small statesCayman IslandsCentral African RepublicCentral Europe and the BalticsChadChannel IslandsChileChinaColombiaComorosCongo, Dem. Rep.Congo, Rep.Costa RicaCote d'IvoireCroatiaCubaCuracaoCyprusCzech RepublicDenmarkDjiboutiDominicaDominican RepublicEarly-demographic dividendEast Asia & PacificEast Asia & Pacific (excluding high income)East Asia & Pacific (IDA & IBRD countries)EcuadorEgypt, Arab Rep.El SalvadorEquatorial GuineaEritreaEstoniaEthiopiaEuro areaEurope & Central AsiaEurope & Central Asia (excluding high income)Europe & Central Asia (IDA & IBRD countries)European UnionFaroe IslandsFijiFinlandFragile and conflict affected situationsFranceFrench PolynesiaGabonGambia, TheGeorgiaGermanyGhanaGreeceGreenlandGrenadaGuamGuatemalaGuineaGuinea-BissauGuyanaHaitiHeavily indebted poor countries (HIPC)High incomeHondurasHong Kong SAR, ChinaHungaryIBRD onlyIcelandIDA & IBRD totalIDA blendIDA onlyIDA totalIndiaIndonesiaIran, Islamic Rep.IraqIrelandIsle of ManIsraelItalyJamaicaJapanJordanKazakhstanKenyaKiribatiKorea, Dem. People’s Rep.Korea, Rep.KosovoKuwaitKyrgyz RepublicLao PDRLate-demographic dividendLatin America & Caribbean Latin America & Caribbean (excluding high income)Latin America & the Caribbean (IDA & IBRD countries)LatviaLeast developed countries: UN classificationLebanonLesothoLiberiaLibyaLiechtensteinLithuaniaLow & middle incomeLow incomeLower middle incomeLuxembourgMacao SAR, ChinaMacedonia, FYRMadagascarMalawiMalaysiaMaldivesMaliMaltaMarshall IslandsMauritaniaMauritiusMexicoMicronesia, Fed. Sts.Middle East & North AfricaMiddle East & North Africa (excluding high income)Middle East & North Africa (IDA & IBRD countries)Middle incomeMoldovaMonacoMongoliaMontenegroMoroccoMozambiqueMyanmarNamibiaNepalNetherlandsNew CaledoniaNew ZealandNicaraguaNigerNigeriaNorth AmericaNorwayOECD membersOmanOther small statesPacific island small statesPakistanPalauPanamaPapua New GuineaParaguayPeruPhilippinesPolandPortugalPost-demographic dividendPre-demographic dividendPuerto RicoQatarRomaniaRussian FederationRwandaSamoaSan MarinoSao Tome and PrincipeSaudi ArabiaSenegalSerbiaSeychellesSierra LeoneSingaporeSint Maarten (Dutch part)Slovak RepublicSloveniaSmall statesSolomon IslandsSomaliaSouth AfricaSouth AsiaSouth Asia (IDA & IBRD)South SudanSpainSri LankaSt. Kitts and NevisSt. LuciaSt. Martin (French part)St. Vincent and the GrenadinesSub-Saharan Africa Sub-Saharan Africa (excluding high income)Sub-Saharan Africa (IDA & IBRD countries)SudanSurinameSwazilandSwedenSwitzerlandSyrian Arab RepublicTajikistanTanzaniaThailandTimor-LesteTogoTongaTrinidad and TobagoTunisiaTurkeyTurkmenistanUgandaUkraineUnited Arab EmiratesUnited KingdomUnited StatesUpper middle incomeUruguayUzbekistanVanuatuVenezuela, RBVietnamVirgin Islands (U.S.)West Bank and GazaWorldYemen, Rep.ZambiaZimbabwe Timeline:
This timeline shows a graph from 1961 to 2015 of Tonga. No data until 1960. Number of actual observations by date: 55.
Source name:
World Development Indicators
Source organization:
(1) United Nations Population Division. World Population Prospects, (2) Census reports and other statistical publications from national statistical offices, (3) Eurostat: Demographic Statistics, (4) United Nations Statistical Division. Population and Vital Statistics Reprot (various years), (5) U.S. Census Bureau: International Database, and (6) Secretariat of the Pacific Community: Statistics and Demography Programme.
Categories, topics:
Health
Last updated:
apr 23, 2017
Indicators value changes by year
Minimum:
24.846
jan 1, 2015
Maximum:
47.175
jan 1, 1961
At the date of observation
Value
Absolute change
Change from previous value
jan 1, 1961
47.175
+47.175
0.0%
jan 1, 1962
46.721
-0.454
-0.96%
jan 1, 1963
46.124
-0.597
-1.28%
jan 1, 1964
45.38
-0.744
-1.61%
jan 1, 1965
44.491
-0.889
-1.96%
jan 1, 1966
43.437
-1.054
-2.37%
jan 1, 1967
42.192
-1.245
-2.87%
jan 1, 1968
40.783
-1.409
-3.34%
jan 1, 1969
39.266
-1.517
-3.72%
jan 1, 1970
37.713
-1.553
-3.96%
jan 1, 1971
36.235
-1.478
-3.92%
jan 1, 1972
34.951
-1.284
-3.54%
jan 1, 1973
33.938
-1.013
-2.9%
jan 1, 1974
33.241
-0.697
-2.05%
jan 1, 1975
32.873
-0.368
-1.11%
jan 1, 1976
32.825
-0.048
-0.15%
jan 1, 1977
33.051
+0.226
0.69%
jan 1, 1978
33.441
+0.39
1.18%
jan 1, 1979
33.883
+0.442
1.32%
jan 1, 1980
34.3
+0.417
1.23%
jan 1, 1981
34.601
+0.301
0.88%
jan 1, 1982
34.707
+0.106
0.31%
jan 1, 1983
34.61
-0.097
-0.28%
jan 1, 1984
34.322
-0.288
-0.83%
jan 1, 1985
33.857
-0.465
-1.35%
jan 1, 1986
33.275
-0.582
-1.72%
jan 1, 1987
32.659
-0.616
-1.85%
jan 1, 1988
32.097
-0.562
-1.72%
jan 1, 1989
31.644
-0.453
-1.41%
jan 1, 1990
31.319
-0.325
-1.03%
jan 1, 1991
31.092
-0.227
-0.72%
jan 1, 1992
30.903
-0.189
-0.61%
jan 1, 1993
30.678
-0.225
-0.73%
jan 1, 1994
30.372
-0.306
-1.0%
jan 1, 1995
29.983
-0.389
-1.28%
jan 1, 1996
29.543
-0.44
-1.47%
jan 1, 1997
29.108
-0.435
-1.47%
jan 1, 1998
28.739
-0.369
-1.27%
jan 1, 1999
28.478
-0.261
-0.91%
jan 1, 2000
28.334
-0.144
-0.51%
jan 1, 2001
28.303
-0.031
-0.11%
jan 1, 2002
28.365
+0.062
0.22%
jan 1, 2003
28.468
+0.103
0.36%
jan 1, 2004
28.565
+0.097
0.34%
jan 1, 2005
28.624
+0.059
0.21%
jan 1, 2006
28.611
-0.013
-0.05%
jan 1, 2007
28.499
-0.112
-0.39%
jan 1, 2008
28.288
-0.211
-0.74%
jan 1, 2009
27.982
-0.306
-1.08%
jan 1, 2010
27.588
-0.394
-1.41%
jan 1, 2011
27.112
-0.476
-1.73%
jan 1, 2012
26.57
-0.542
-2.0%
jan 1, 2013
25.992
-0.578
-2.18%
jan 1, 2014
25.409
-0.583
-2.24%
jan 1, 2015
24.846
-0.563
-2.22%
Ranking of countries by current statistics by years


Comments: