29
/
en
AIzaSyAYiBZKx7MnpbEhh9jyipgxe19OcubqV5w
April 1, 2024
284341
Yemen, Rep.
YEM
true
2
1
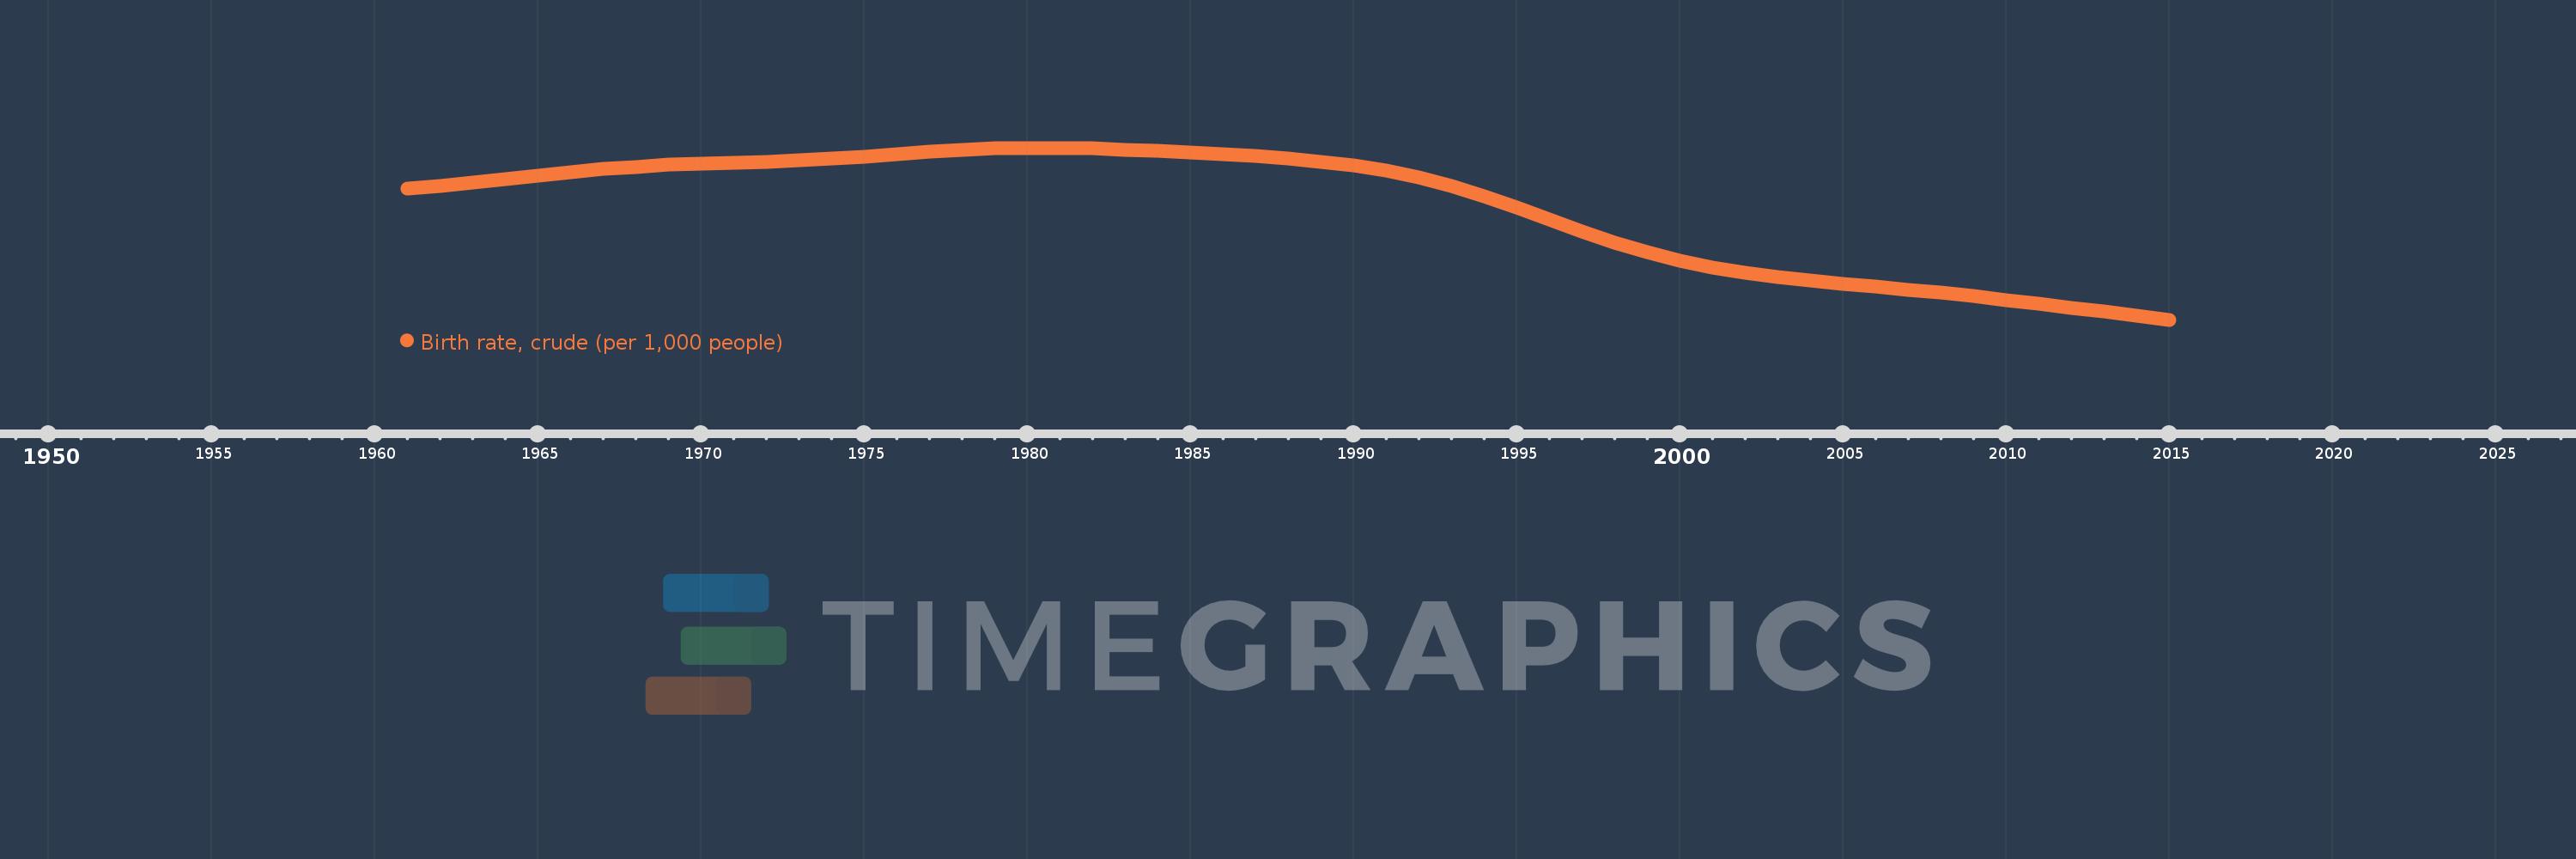
Birth rate, crude (per 1,000 people)
2015,2014,2013,2012,2011,2010,2009,2008,2007,2006,2005,2004,2003,2002,2001,2000,1999,1998,1997,1996,1995,1994,1993,1992,1991,1990,1989,1988,1987,1986,1985,1984,1983,1982,1981,1980,1979,1978,1977,1976,1975,1974,1973,1972,1971,1970,1969,1968,1967,1966,1965,1964,1963,1962,1961
This statistics in other country:
AfghanistanAlbaniaAlgeriaAmerican SamoaAndorraAngolaAntigua and BarbudaArab WorldArgentinaArmeniaArubaAustraliaAustriaAzerbaijanBahamas, TheBahrainBangladeshBarbadosBelarusBelgiumBelizeBeninBermudaBhutanBoliviaBosnia and HerzegovinaBotswanaBrazilBrunei DarussalamBulgariaBurkina FasoBurundiCabo VerdeCambodiaCameroonCanadaCaribbean small statesCayman IslandsCentral African RepublicCentral Europe and the BalticsChadChannel IslandsChileChinaColombiaComorosCongo, Dem. Rep.Congo, Rep.Costa RicaCote d'IvoireCroatiaCubaCuracaoCyprusCzech RepublicDenmarkDjiboutiDominicaDominican RepublicEarly-demographic dividendEast Asia & PacificEast Asia & Pacific (excluding high income)East Asia & Pacific (IDA & IBRD countries)EcuadorEgypt, Arab Rep.El SalvadorEquatorial GuineaEritreaEstoniaEthiopiaEuro areaEurope & Central AsiaEurope & Central Asia (excluding high income)Europe & Central Asia (IDA & IBRD countries)European UnionFaroe IslandsFijiFinlandFragile and conflict affected situationsFranceFrench PolynesiaGabonGambia, TheGeorgiaGermanyGhanaGreeceGreenlandGrenadaGuamGuatemalaGuineaGuinea-BissauGuyanaHaitiHeavily indebted poor countries (HIPC)High incomeHondurasHong Kong SAR, ChinaHungaryIBRD onlyIcelandIDA & IBRD totalIDA blendIDA onlyIDA totalIndiaIndonesiaIran, Islamic Rep.IraqIrelandIsle of ManIsraelItalyJamaicaJapanJordanKazakhstanKenyaKiribatiKorea, Dem. People’s Rep.Korea, Rep.KosovoKuwaitKyrgyz RepublicLao PDRLate-demographic dividendLatin America & Caribbean Latin America & Caribbean (excluding high income)Latin America & the Caribbean (IDA & IBRD countries)LatviaLeast developed countries: UN classificationLebanonLesothoLiberiaLibyaLiechtensteinLithuaniaLow & middle incomeLow incomeLower middle incomeLuxembourgMacao SAR, ChinaMacedonia, FYRMadagascarMalawiMalaysiaMaldivesMaliMaltaMarshall IslandsMauritaniaMauritiusMexicoMicronesia, Fed. Sts.Middle East & North AfricaMiddle East & North Africa (excluding high income)Middle East & North Africa (IDA & IBRD countries)Middle incomeMoldovaMonacoMongoliaMontenegroMoroccoMozambiqueMyanmarNamibiaNepalNetherlandsNew CaledoniaNew ZealandNicaraguaNigerNigeriaNorth AmericaNorwayOECD membersOmanOther small statesPacific island small statesPakistanPalauPanamaPapua New GuineaParaguayPeruPhilippinesPolandPortugalPost-demographic dividendPre-demographic dividendPuerto RicoQatarRomaniaRussian FederationRwandaSamoaSan MarinoSao Tome and PrincipeSaudi ArabiaSenegalSerbiaSeychellesSierra LeoneSingaporeSint Maarten (Dutch part)Slovak RepublicSloveniaSmall statesSolomon IslandsSomaliaSouth AfricaSouth AsiaSouth Asia (IDA & IBRD)South SudanSpainSri LankaSt. Kitts and NevisSt. LuciaSt. Martin (French part)St. Vincent and the GrenadinesSub-Saharan Africa Sub-Saharan Africa (excluding high income)Sub-Saharan Africa (IDA & IBRD countries)SudanSurinameSwazilandSwedenSwitzerlandSyrian Arab RepublicTajikistanTanzaniaThailandTimor-LesteTogoTongaTrinidad and TobagoTunisiaTurkeyTurkmenistanUgandaUkraineUnited Arab EmiratesUnited KingdomUnited StatesUpper middle incomeUruguayUzbekistanVanuatuVenezuela, RBVietnamVirgin Islands (U.S.)West Bank and GazaWorldYemen, Rep.ZambiaZimbabwe Timeline:
This timeline shows a graph from 1961 to 2015 of Yemen, Rep.. No data until 1960. Number of actual observations by date: 55.
Source name:
World Development Indicators
Source organization:
(1) United Nations Population Division. World Population Prospects, (2) Census reports and other statistical publications from national statistical offices, (3) Eurostat: Demographic Statistics, (4) United Nations Statistical Division. Population and Vital Statistics Reprot (various years), (5) U.S. Census Bureau: International Database, and (6) Secretariat of the Pacific Community: Statistics and Demography Programme.
Categories, topics:
Health
Last updated:
apr 23, 2017
Indicators value changes by year
Minimum:
32.418
jan 1, 2015
Maximum:
55.139
jan 1, 1980
At the date of observation
Value
Absolute change
Change from previous value
jan 1, 1961
49.778
+49.778
0.0%
jan 1, 1962
50.151
+0.373
0.75%
jan 1, 1963
50.568
+0.417
0.83%
jan 1, 1964
51.018
+0.45
0.89%
jan 1, 1965
51.484
+0.466
0.91%
jan 1, 1966
51.933
+0.449
0.87%
jan 1, 1967
52.329
+0.396
0.76%
jan 1, 1968
52.654
+0.325
0.62%
jan 1, 1969
52.901
+0.247
0.47%
jan 1, 1970
53.074
+0.173
0.33%
jan 1, 1971
53.202
+0.128
0.24%
jan 1, 1972
53.328
+0.126
0.24%
jan 1, 1973
53.491
+0.163
0.31%
jan 1, 1974
53.711
+0.22
0.41%
jan 1, 1975
53.987
+0.276
0.51%
jan 1, 1976
54.297
+0.31
0.57%
jan 1, 1977
54.606
+0.309
0.57%
jan 1, 1978
54.869
+0.263
0.48%
jan 1, 1979
55.051
+0.182
0.33%
jan 1, 1980
55.139
+0.088
0.16%
jan 1, 1981
55.134
-0.005
-0.01%
jan 1, 1982
55.054
-0.08
-0.15%
jan 1, 1983
54.924
-0.13
-0.24%
jan 1, 1984
54.761
-0.163
-0.3%
jan 1, 1985
54.564
-0.197
-0.36%
jan 1, 1986
54.332
-0.232
-0.43%
jan 1, 1987
54.061
-0.271
-0.5%
jan 1, 1988
53.732
-0.329
-0.61%
jan 1, 1989
53.32
-0.412
-0.77%
jan 1, 1990
52.802
-0.518
-0.97%
jan 1, 1991
52.125
-0.677
-1.28%
jan 1, 1992
51.231
-0.894
-1.72%
jan 1, 1993
50.108
-1.123
-2.19%
jan 1, 1994
48.777
-1.331
-2.66%
jan 1, 1995
47.282
-1.495
-3.06%
jan 1, 1996
45.698
-1.584
-3.35%
jan 1, 1997
44.12
-1.578
-3.45%
jan 1, 1998
42.637
-1.483
-3.36%
jan 1, 1999
41.321
-1.316
-3.09%
jan 1, 2000
40.209
-1.112
-2.69%
jan 1, 2001
39.319
-0.89
-2.21%
jan 1, 2002
38.634
-0.685
-1.74%
jan 1, 2003
38.091
-0.543
-1.41%
jan 1, 2004
37.626
-0.465
-1.22%
jan 1, 2005
37.207
-0.419
-1.11%
jan 1, 2006
36.804
-0.403
-1.08%
jan 1, 2007
36.394
-0.41
-1.11%
jan 1, 2008
35.969
-0.425
-1.17%
jan 1, 2009
35.524
-0.445
-1.24%
jan 1, 2010
35.05
-0.474
-1.33%
jan 1, 2011
34.546
-0.504
-1.44%
jan 1, 2012
34.017
-0.529
-1.53%
jan 1, 2013
33.481
-0.536
-1.58%
jan 1, 2014
32.947
-0.534
-1.59%
jan 1, 2015
32.418
-0.529
-1.61%
Ranking of countries by current statistics by years


Comments: