29
/
en
AIzaSyAYiBZKx7MnpbEhh9jyipgxe19OcubqV5w
April 1, 2024
47945
Middle East & North Africa
MEA
false
2
1
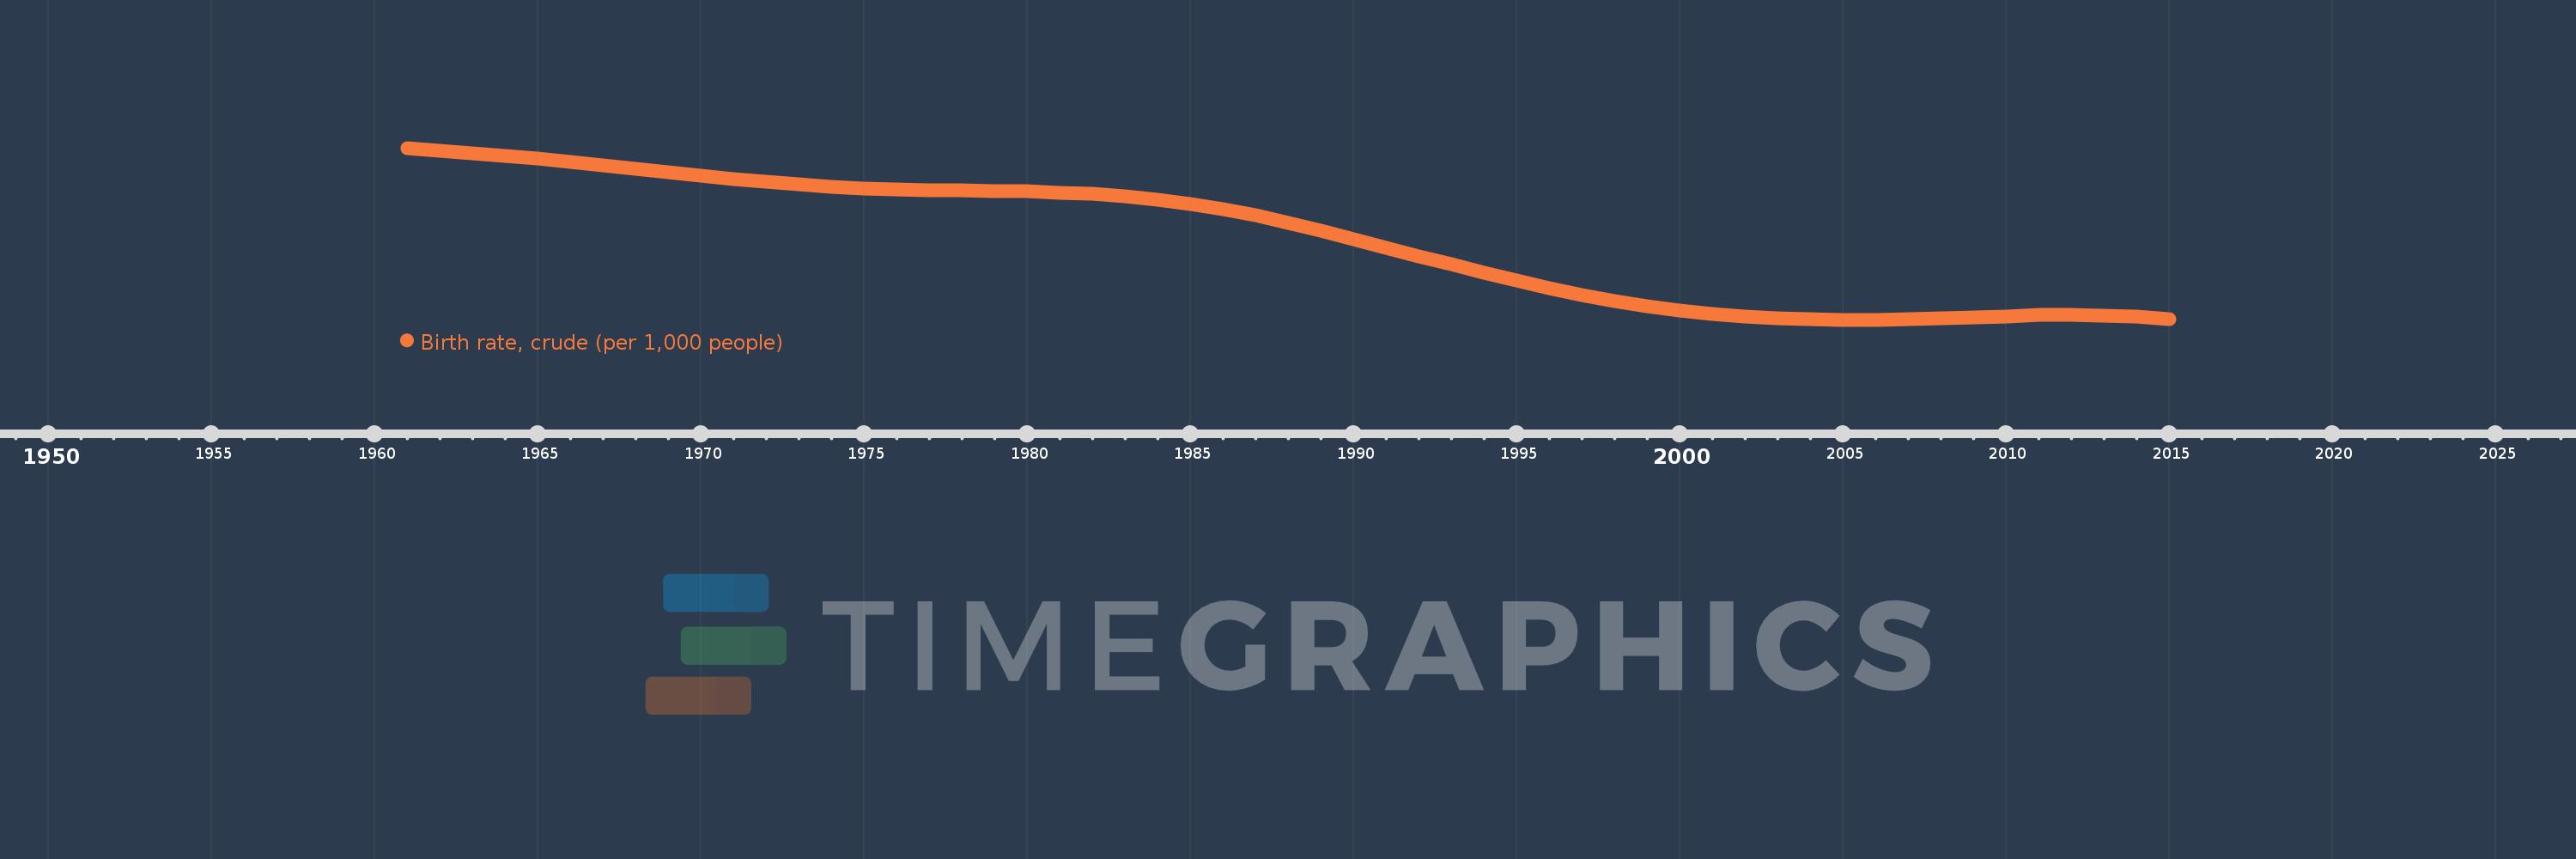
Birth rate, crude (per 1,000 people)
2015,2014,2013,2012,2011,2010,2009,2008,2007,2006,2005,2004,2003,2002,2001,2000,1999,1998,1997,1996,1995,1994,1993,1992,1991,1990,1989,1988,1987,1986,1985,1984,1983,1982,1981,1980,1979,1978,1977,1976,1975,1974,1973,1972,1971,1970,1969,1968,1967,1966,1965,1964,1963,1962,1961
This statistics in other country:
AfghanistanAlbaniaAlgeriaAmerican SamoaAndorraAngolaAntigua and BarbudaArab WorldArgentinaArmeniaArubaAustraliaAustriaAzerbaijanBahamas, TheBahrainBangladeshBarbadosBelarusBelgiumBelizeBeninBermudaBhutanBoliviaBosnia and HerzegovinaBotswanaBrazilBrunei DarussalamBulgariaBurkina FasoBurundiCabo VerdeCambodiaCameroonCanadaCaribbean small statesCayman IslandsCentral African RepublicCentral Europe and the BalticsChadChannel IslandsChileChinaColombiaComorosCongo, Dem. Rep.Congo, Rep.Costa RicaCote d'IvoireCroatiaCubaCuracaoCyprusCzech RepublicDenmarkDjiboutiDominicaDominican RepublicEarly-demographic dividendEast Asia & PacificEast Asia & Pacific (excluding high income)East Asia & Pacific (IDA & IBRD countries)EcuadorEgypt, Arab Rep.El SalvadorEquatorial GuineaEritreaEstoniaEthiopiaEuro areaEurope & Central AsiaEurope & Central Asia (excluding high income)Europe & Central Asia (IDA & IBRD countries)European UnionFaroe IslandsFijiFinlandFragile and conflict affected situationsFranceFrench PolynesiaGabonGambia, TheGeorgiaGermanyGhanaGreeceGreenlandGrenadaGuamGuatemalaGuineaGuinea-BissauGuyanaHaitiHeavily indebted poor countries (HIPC)High incomeHondurasHong Kong SAR, ChinaHungaryIBRD onlyIcelandIDA & IBRD totalIDA blendIDA onlyIDA totalIndiaIndonesiaIran, Islamic Rep.IraqIrelandIsle of ManIsraelItalyJamaicaJapanJordanKazakhstanKenyaKiribatiKorea, Dem. People’s Rep.Korea, Rep.KosovoKuwaitKyrgyz RepublicLao PDRLate-demographic dividendLatin America & Caribbean Latin America & Caribbean (excluding high income)Latin America & the Caribbean (IDA & IBRD countries)LatviaLeast developed countries: UN classificationLebanonLesothoLiberiaLibyaLiechtensteinLithuaniaLow & middle incomeLow incomeLower middle incomeLuxembourgMacao SAR, ChinaMacedonia, FYRMadagascarMalawiMalaysiaMaldivesMaliMaltaMarshall IslandsMauritaniaMauritiusMexicoMicronesia, Fed. Sts.Middle East & North AfricaMiddle East & North Africa (excluding high income)Middle East & North Africa (IDA & IBRD countries)Middle incomeMoldovaMonacoMongoliaMontenegroMoroccoMozambiqueMyanmarNamibiaNepalNetherlandsNew CaledoniaNew ZealandNicaraguaNigerNigeriaNorth AmericaNorwayOECD membersOmanOther small statesPacific island small statesPakistanPalauPanamaPapua New GuineaParaguayPeruPhilippinesPolandPortugalPost-demographic dividendPre-demographic dividendPuerto RicoQatarRomaniaRussian FederationRwandaSamoaSan MarinoSao Tome and PrincipeSaudi ArabiaSenegalSerbiaSeychellesSierra LeoneSingaporeSint Maarten (Dutch part)Slovak RepublicSloveniaSmall statesSolomon IslandsSomaliaSouth AfricaSouth AsiaSouth Asia (IDA & IBRD)South SudanSpainSri LankaSt. Kitts and NevisSt. LuciaSt. Martin (French part)St. Vincent and the GrenadinesSub-Saharan Africa Sub-Saharan Africa (excluding high income)Sub-Saharan Africa (IDA & IBRD countries)SudanSurinameSwazilandSwedenSwitzerlandSyrian Arab RepublicTajikistanTanzaniaThailandTimor-LesteTogoTongaTrinidad and TobagoTunisiaTurkeyTurkmenistanUgandaUkraineUnited Arab EmiratesUnited KingdomUnited StatesUpper middle incomeUruguayUzbekistanVanuatuVenezuela, RBVietnamVirgin Islands (U.S.)West Bank and GazaWorldYemen, Rep.ZambiaZimbabwe Timeline:
This timeline shows a graph from 1961 to 2015 of Middle East & North Africa. No data until 1960. Number of actual observations by date: 55.
Source name:
World Development Indicators
Source organization:
(1) United Nations Population Division. World Population Prospects, (2) Census reports and other statistical publications from national statistical offices, (3) Eurostat: Demographic Statistics, (4) United Nations Statistical Division. Population and Vital Statistics Reprot (various years), (5) U.S. Census Bureau: International Database, and (6) Secretariat of the Pacific Community: Statistics and Demography Programme.
Categories, topics:
Health
Last updated:
apr 23, 2017
Indicators value changes by year
Minimum:
23.692
jan 1, 2006
At the date of observation
Value
Absolute change
Change from previous value
jan 1, 1961
47.31
+47.31
0.0%
jan 1, 1962
46.942
-0.369
-0.78%
jan 1, 1963
46.586
-0.355
-0.76%
jan 1, 1964
46.213
-0.373
-0.8%
jan 1, 1965
45.832
-0.381
-0.83%
jan 1, 1966
45.407
-0.425
-0.93%
jan 1, 1967
44.948
-0.459
-1.01%
jan 1, 1968
44.426
-0.522
-1.16%
jan 1, 1969
43.963
-0.463
-1.04%
jan 1, 1970
43.488
-0.475
-1.08%
jan 1, 1971
43.029
-0.458
-1.05%
jan 1, 1972
42.65
-0.38
-0.88%
jan 1, 1973
42.273
-0.376
-0.88%
jan 1, 1974
41.974
-0.299
-0.71%
jan 1, 1975
41.766
-0.208
-0.5%
jan 1, 1976
41.621
-0.145
-0.35%
jan 1, 1977
41.544
-0.078
-0.19%
jan 1, 1978
41.464
-0.08
-0.19%
jan 1, 1979
41.395
-0.069
-0.17%
jan 1, 1980
41.324
-0.07
-0.17%
jan 1, 1981
41.192
-0.132
-0.32%
jan 1, 1982
40.967
-0.225
-0.55%
jan 1, 1983
40.662
-0.305
-0.74%
jan 1, 1984
40.223
-0.44
-1.08%
jan 1, 1985
39.646
-0.577
-1.43%
jan 1, 1986
38.916
-0.73
-1.84%
jan 1, 1987
38.03
-0.887
-2.28%
jan 1, 1988
37.015
-1.015
-2.67%
jan 1, 1989
35.91
-1.105
-2.99%
jan 1, 1990
34.737
-1.173
-3.27%
jan 1, 1991
33.561
-1.175
-3.38%
jan 1, 1992
32.361
-1.2
-3.58%
jan 1, 1993
31.291
-1.07
-3.31%
jan 1, 1994
30.139
-1.152
-3.68%
jan 1, 1995
29.039
-1.101
-3.65%
jan 1, 1996
27.97
-1.068
-3.68%
jan 1, 1997
27.078
-0.893
-3.19%
jan 1, 1998
26.285
-0.793
-2.93%
jan 1, 1999
25.585
-0.7
-2.66%
jan 1, 2000
24.971
-0.615
-2.4%
jan 1, 2001
24.52
-0.45
-1.8%
jan 1, 2002
24.157
-0.363
-1.48%
jan 1, 2003
23.913
-0.244
-1.01%
jan 1, 2004
23.787
-0.127
-0.53%
jan 1, 2005
23.697
-0.089
-0.38%
jan 1, 2006
23.692
-0.005
-0.02%
jan 1, 2007
23.762
+0.07
0.29%
jan 1, 2008
23.888
+0.126
0.53%
jan 1, 2009
24.036
+0.148
0.62%
jan 1, 2010
24.184
+0.148
0.61%
jan 1, 2011
24.322
+0.139
0.57%
jan 1, 2012
24.349
+0.026
0.11%
jan 1, 2013
24.293
-0.056
-0.23%
jan 1, 2014
24.101
-0.192
-0.79%
jan 1, 2015
23.796
-0.306
-1.27%
Ranking of countries by current statistics by years


Comments: