29
/
en
AIzaSyAYiBZKx7MnpbEhh9jyipgxe19OcubqV5w
April 1, 2024
52434
OECD members
OED
false
2
1
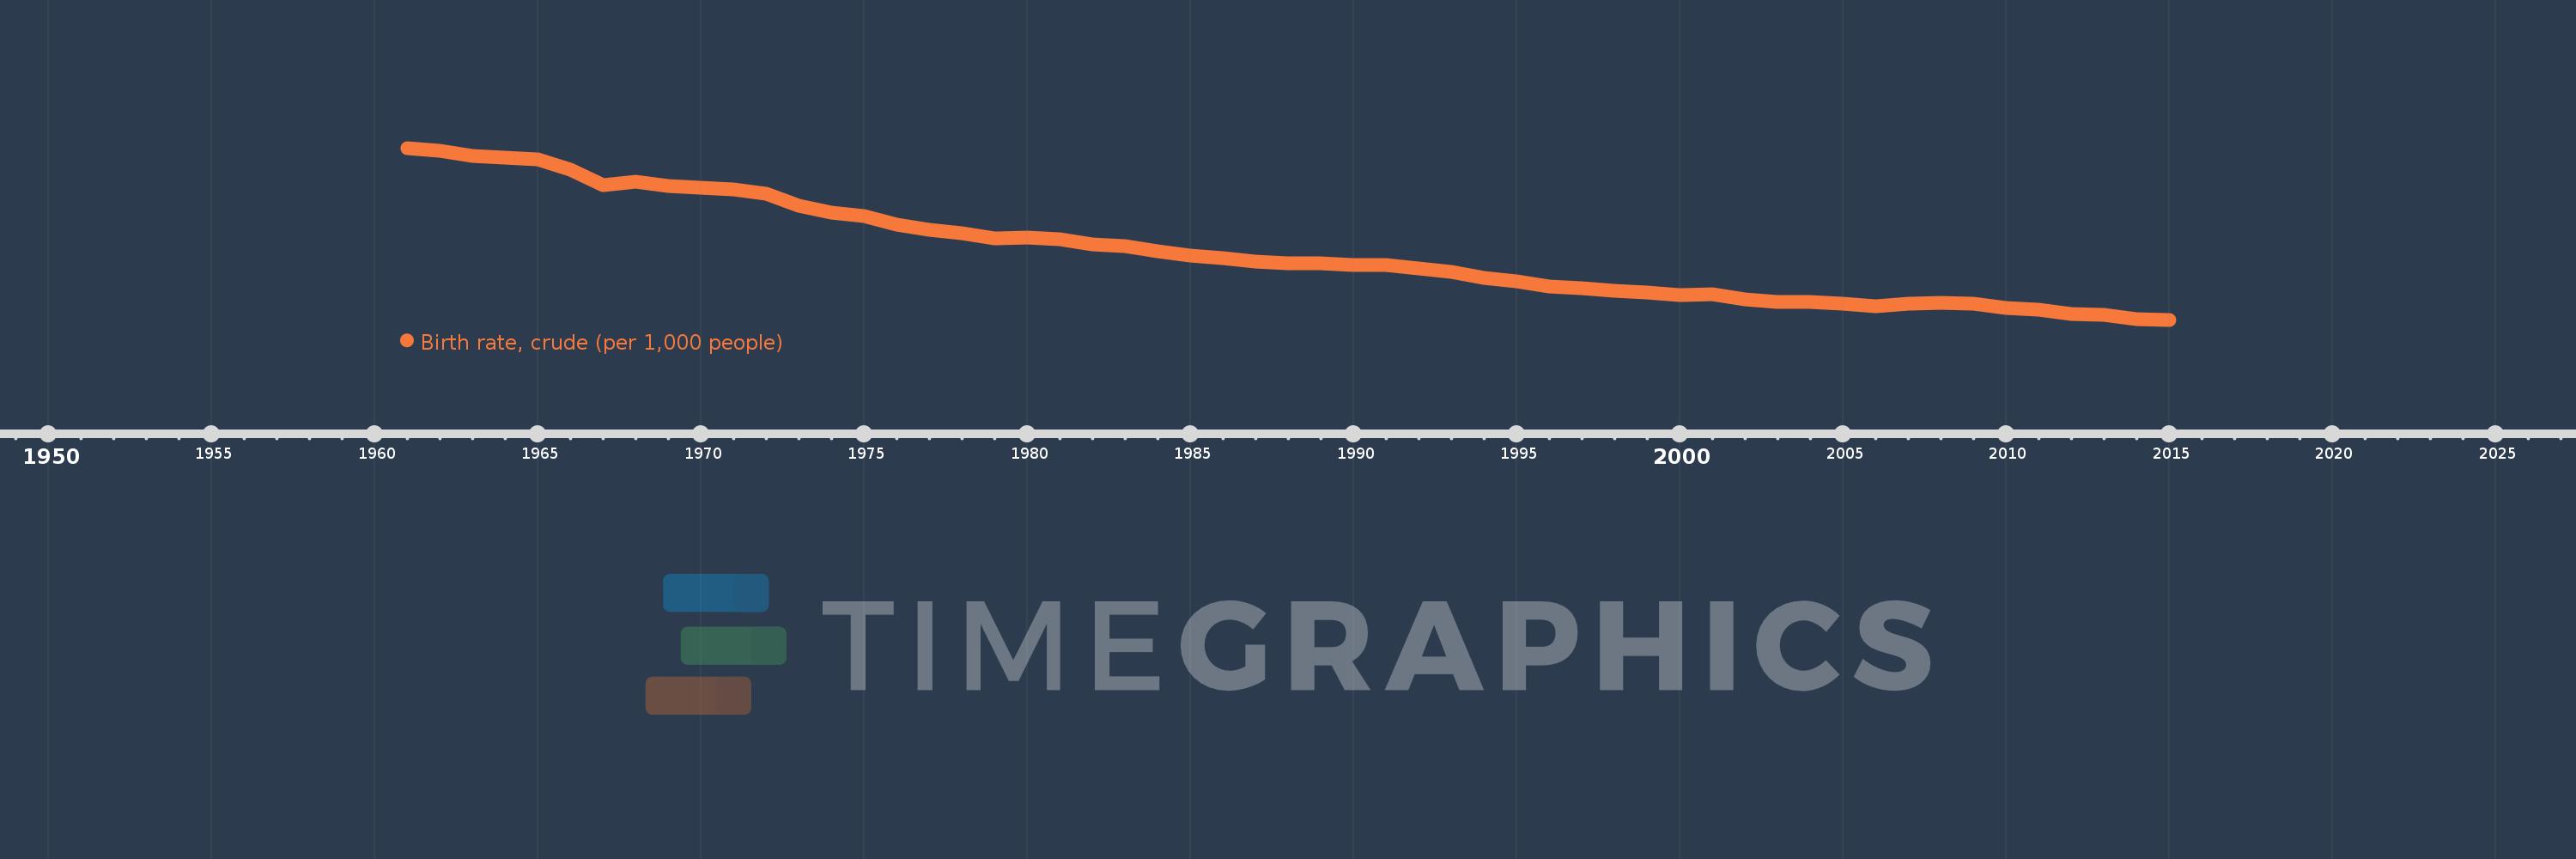
Birth rate, crude (per 1,000 people)
2015,2014,2013,2012,2011,2010,2009,2008,2007,2006,2005,2004,2003,2002,2001,2000,1999,1998,1997,1996,1995,1994,1993,1992,1991,1990,1989,1988,1987,1986,1985,1984,1983,1982,1981,1980,1979,1978,1977,1976,1975,1974,1973,1972,1971,1970,1969,1968,1967,1966,1965,1964,1963,1962,1961
This statistics in other country:
AfghanistanAlbaniaAlgeriaAmerican SamoaAndorraAngolaAntigua and BarbudaArab WorldArgentinaArmeniaArubaAustraliaAustriaAzerbaijanBahamas, TheBahrainBangladeshBarbadosBelarusBelgiumBelizeBeninBermudaBhutanBoliviaBosnia and HerzegovinaBotswanaBrazilBrunei DarussalamBulgariaBurkina FasoBurundiCabo VerdeCambodiaCameroonCanadaCaribbean small statesCayman IslandsCentral African RepublicCentral Europe and the BalticsChadChannel IslandsChileChinaColombiaComorosCongo, Dem. Rep.Congo, Rep.Costa RicaCote d'IvoireCroatiaCubaCuracaoCyprusCzech RepublicDenmarkDjiboutiDominicaDominican RepublicEarly-demographic dividendEast Asia & PacificEast Asia & Pacific (excluding high income)East Asia & Pacific (IDA & IBRD countries)EcuadorEgypt, Arab Rep.El SalvadorEquatorial GuineaEritreaEstoniaEthiopiaEuro areaEurope & Central AsiaEurope & Central Asia (excluding high income)Europe & Central Asia (IDA & IBRD countries)European UnionFaroe IslandsFijiFinlandFragile and conflict affected situationsFranceFrench PolynesiaGabonGambia, TheGeorgiaGermanyGhanaGreeceGreenlandGrenadaGuamGuatemalaGuineaGuinea-BissauGuyanaHaitiHeavily indebted poor countries (HIPC)High incomeHondurasHong Kong SAR, ChinaHungaryIBRD onlyIcelandIDA & IBRD totalIDA blendIDA onlyIDA totalIndiaIndonesiaIran, Islamic Rep.IraqIrelandIsle of ManIsraelItalyJamaicaJapanJordanKazakhstanKenyaKiribatiKorea, Dem. People’s Rep.Korea, Rep.KosovoKuwaitKyrgyz RepublicLao PDRLate-demographic dividendLatin America & Caribbean Latin America & Caribbean (excluding high income)Latin America & the Caribbean (IDA & IBRD countries)LatviaLeast developed countries: UN classificationLebanonLesothoLiberiaLibyaLiechtensteinLithuaniaLow & middle incomeLow incomeLower middle incomeLuxembourgMacao SAR, ChinaMacedonia, FYRMadagascarMalawiMalaysiaMaldivesMaliMaltaMarshall IslandsMauritaniaMauritiusMexicoMicronesia, Fed. Sts.Middle East & North AfricaMiddle East & North Africa (excluding high income)Middle East & North Africa (IDA & IBRD countries)Middle incomeMoldovaMonacoMongoliaMontenegroMoroccoMozambiqueMyanmarNamibiaNepalNetherlandsNew CaledoniaNew ZealandNicaraguaNigerNigeriaNorth AmericaNorwayOECD membersOmanOther small statesPacific island small statesPakistanPalauPanamaPapua New GuineaParaguayPeruPhilippinesPolandPortugalPost-demographic dividendPre-demographic dividendPuerto RicoQatarRomaniaRussian FederationRwandaSamoaSan MarinoSao Tome and PrincipeSaudi ArabiaSenegalSerbiaSeychellesSierra LeoneSingaporeSint Maarten (Dutch part)Slovak RepublicSloveniaSmall statesSolomon IslandsSomaliaSouth AfricaSouth AsiaSouth Asia (IDA & IBRD)South SudanSpainSri LankaSt. Kitts and NevisSt. LuciaSt. Martin (French part)St. Vincent and the GrenadinesSub-Saharan Africa Sub-Saharan Africa (excluding high income)Sub-Saharan Africa (IDA & IBRD countries)SudanSurinameSwazilandSwedenSwitzerlandSyrian Arab RepublicTajikistanTanzaniaThailandTimor-LesteTogoTongaTrinidad and TobagoTunisiaTurkeyTurkmenistanUgandaUkraineUnited Arab EmiratesUnited KingdomUnited StatesUpper middle incomeUruguayUzbekistanVanuatuVenezuela, RBVietnamVirgin Islands (U.S.)West Bank and GazaWorldYemen, Rep.ZambiaZimbabwe Timeline:
This timeline shows a graph from 1961 to 2015 of OECD members. No data until 1960. Number of actual observations by date: 55.
Source name:
World Development Indicators
Source organization:
(1) United Nations Population Division. World Population Prospects, (2) Census reports and other statistical publications from national statistical offices, (3) Eurostat: Demographic Statistics, (4) United Nations Statistical Division. Population and Vital Statistics Reprot (various years), (5) U.S. Census Bureau: International Database, and (6) Secretariat of the Pacific Community: Statistics and Demography Programme.
Categories, topics:
Health
Last updated:
apr 23, 2017
Indicators value changes by year
Minimum:
11.904
jan 1, 2015
Maximum:
23.093
jan 1, 1961
At the date of observation
Value
Absolute change
Change from previous value
jan 1, 1961
23.093
+23.093
0.0%
jan 1, 1962
22.929
-0.164
-0.71%
jan 1, 1963
22.597
-0.332
-1.45%
jan 1, 1964
22.459
-0.138
-0.61%
jan 1, 1965
22.338
-0.121
-0.54%
jan 1, 1966
21.679
-0.658
-2.95%
jan 1, 1967
20.658
-1.021
-4.71%
jan 1, 1968
20.919
+0.26
1.26%
jan 1, 1969
20.603
-0.315
-1.51%
jan 1, 1970
20.479
-0.124
-0.6%
jan 1, 1971
20.365
-0.114
-0.56%
jan 1, 1972
20.113
-0.252
-1.24%
jan 1, 1973
19.342
-0.771
-3.83%
jan 1, 1974
18.902
-0.44
-2.27%
jan 1, 1975
18.645
-0.257
-1.36%
jan 1, 1976
18.116
-0.529
-2.84%
jan 1, 1977
17.761
-0.355
-1.96%
jan 1, 1978
17.544
-0.217
-1.22%
jan 1, 1979
17.193
-0.351
-2.0%
jan 1, 1980
17.244
+0.051
0.3%
jan 1, 1981
17.12
-0.124
-0.72%
jan 1, 1982
16.815
-0.306
-1.78%
jan 1, 1983
16.683
-0.132
-0.78%
jan 1, 1984
16.344
-0.339
-2.03%
jan 1, 1985
16.084
-0.261
-1.6%
jan 1, 1986
15.937
-0.146
-0.91%
jan 1, 1987
15.666
-0.271
-1.7%
jan 1, 1988
15.558
-0.108
-0.69%
jan 1, 1989
15.561
+0.002
0.01%
jan 1, 1990
15.445
-0.116
-0.74%
jan 1, 1991
15.481
+0.036
0.24%
jan 1, 1992
15.238
-0.244
-1.57%
jan 1, 1993
15.002
-0.236
-1.55%
jan 1, 1994
14.653
-0.349
-2.32%
jan 1, 1995
14.405
-0.248
-1.69%
jan 1, 1996
14.07
-0.335
-2.33%
jan 1, 1997
13.946
-0.124
-0.88%
jan 1, 1998
13.791
-0.155
-1.11%
jan 1, 1999
13.682
-0.109
-0.79%
jan 1, 2000
13.509
-0.174
-1.27%
jan 1, 2001
13.552
+0.043
0.32%
jan 1, 2002
13.23
-0.322
-2.38%
jan 1, 2003
13.069
-0.161
-1.22%
jan 1, 2004
13.042
-0.027
-0.21%
jan 1, 2005
12.929
-0.112
-0.86%
jan 1, 2006
12.801
-0.128
-0.99%
jan 1, 2007
12.931
+0.13
1.02%
jan 1, 2008
12.982
+0.051
0.39%
jan 1, 2009
12.945
-0.037
-0.29%
jan 1, 2010
12.672
-0.273
-2.11%
jan 1, 2011
12.535
-0.137
-1.08%
jan 1, 2012
12.283
-0.251
-2.0%
jan 1, 2013
12.199
-0.084
-0.68%
jan 1, 2014
11.919
-0.28
-2.3%
jan 1, 2015
11.904
-0.015
-0.12%
Ranking of countries by current statistics by years


Comments: